

MANIFOLD TRADING
Case Study: Reimagining Quantitative Intelligence
Manifold Trading is a New York-based systematic, quantitative investment firm specializing in the cryptocurrency and decentralized finance (DeFi) markets. Founded in 2021, the firm blends high-frequency data analysis with sophisticated algorithmic strategies to capitalize on market inefficiencies.
While their internal algorithms are world-class, their external digital presence and internal trading tools lacked a cohesive visual language. As a Digital Design Intern, I spearheaded the design of a new digital platform intended to help traders visualize complex "black box" strategies. My work bridged the gap between raw data and actionable intelligence, establishing a sophisticated brand identity that distances the firm from "crypto-chaos" and moves toward institutional-grade financial design.
-
This was a research and design based project with a primary focus on building a brand identity and design system for a new company product website.
-
TYFYA: Manifold Trading
-
The team comprised of 1 developer, 1 UX researcher and 1 UI designer.
-
UI and Brand Design Intern
-
Client briefing and goal alignment
Analysis of current site and future scope
Preliminary presentations of branding and UI design proposals.
Actioning approved design directions with improvisations and recommendations

Manifold operates at the intersection of high-finance and cutting-edge technology.
PROJECT GOAL: Design a digital trading platform interface that helps traders visualize and interact with complex algorithmic strategies.
Traders at Manifold interact with high-frequency data and complex algorithmic outputs. Previously, these outputs were often dense, text-heavy, and lacked a unified UI, leading to cognitive fatigue. The challenge was to create a visualization layer that simplified complexity without sacrificing depth, all while building a brand that feels as stable as a traditional brokerage but as innovative as a DeFi leader.
KEY RESPONSIBILITIES:
UI/UX Design: Architect the strategy visualization dashboard and component library.
Brand Identity Design: Develop a comprehensive digital style guide to ensure consistency across all touch-points.
THE PROBLEM: LACK OF DATA VISUALIZATION
Traders at Manifold interact with high-frequency data and complex algorithmic outputs. Previously, these outputs are dense, text-heavy, and lacked a unified UI, leading to cognitive fatigue. The challenge was to create a visualization layer that simplified complexity without sacrificing depth, while building a brand that feels as stable as a traditional brokerage but as innovative as a DeFi leader.
THE SOLUTION: a VISUAL FIRST TRADING PLATFORM
A trading platform that:
Translates complex algorithmic strategies into clear visual systems
Balances dense financial data with usability
Maintains brand consistency across digital surfaces
Projects institutional trust rather than speculative hype
Central design focus: visualizing complexity without overwhelming the user.
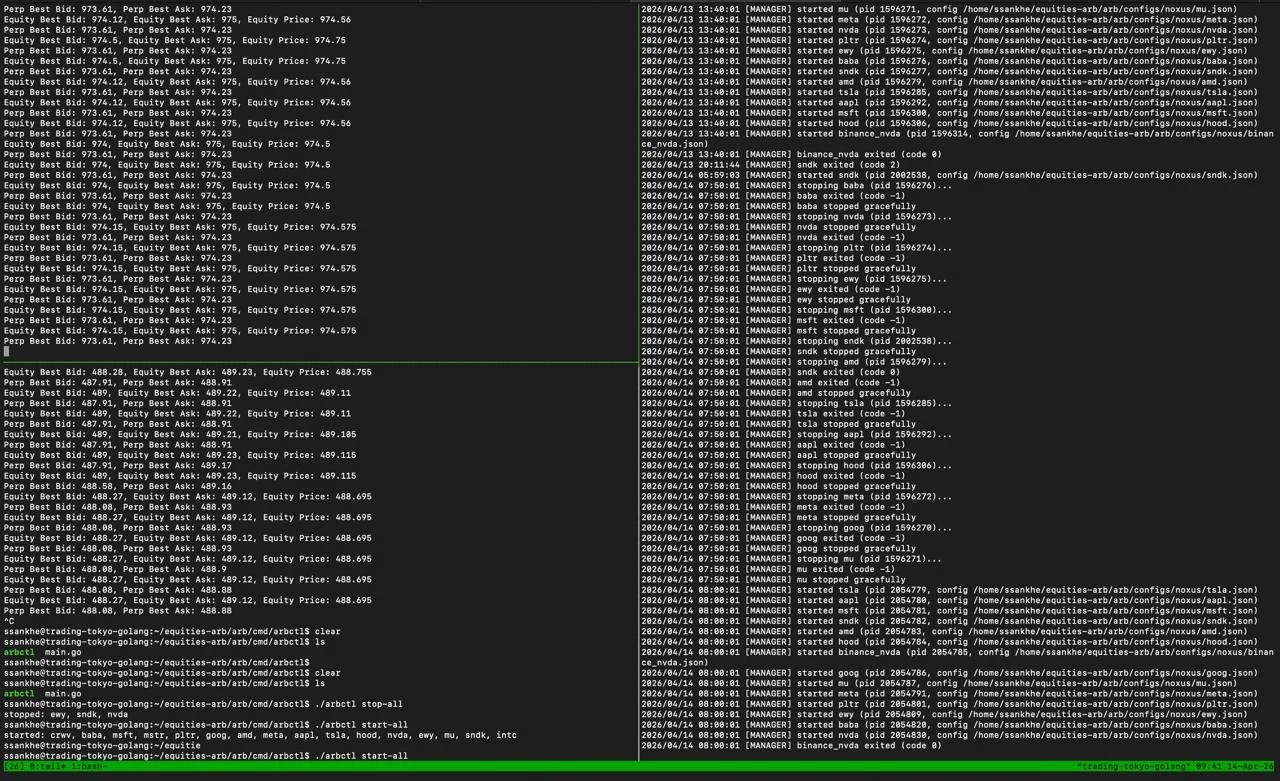
OLD STRATEGY VISUALIZATION
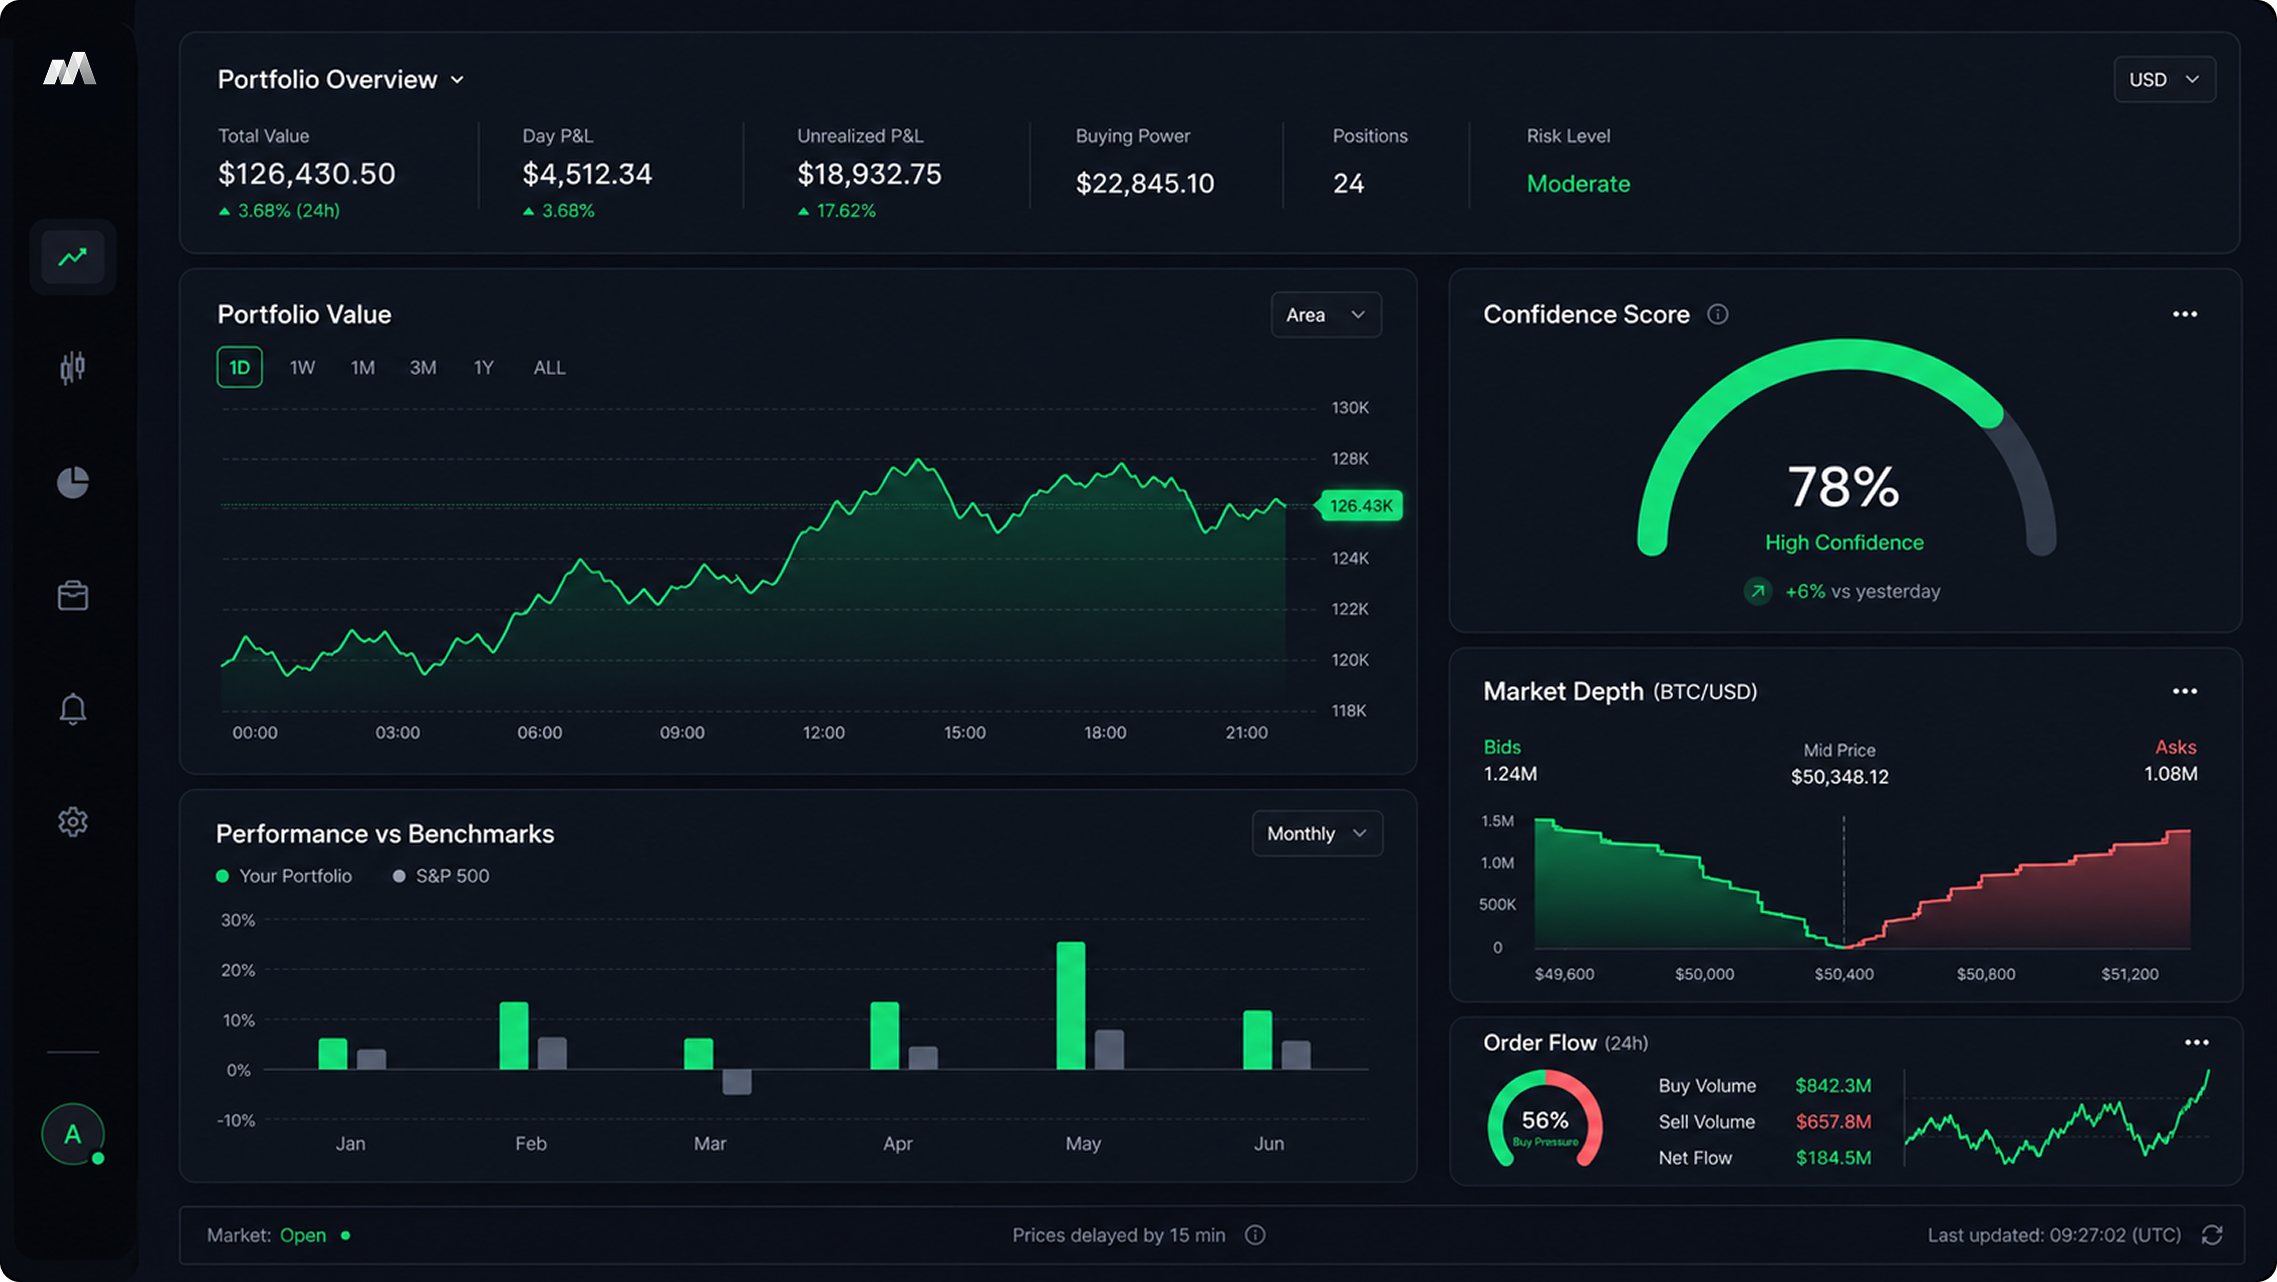
NEW STRATEGY VISUALIZATION
THE PROCESS
THE PROCESS
THE TOOL STACK
Design discovery
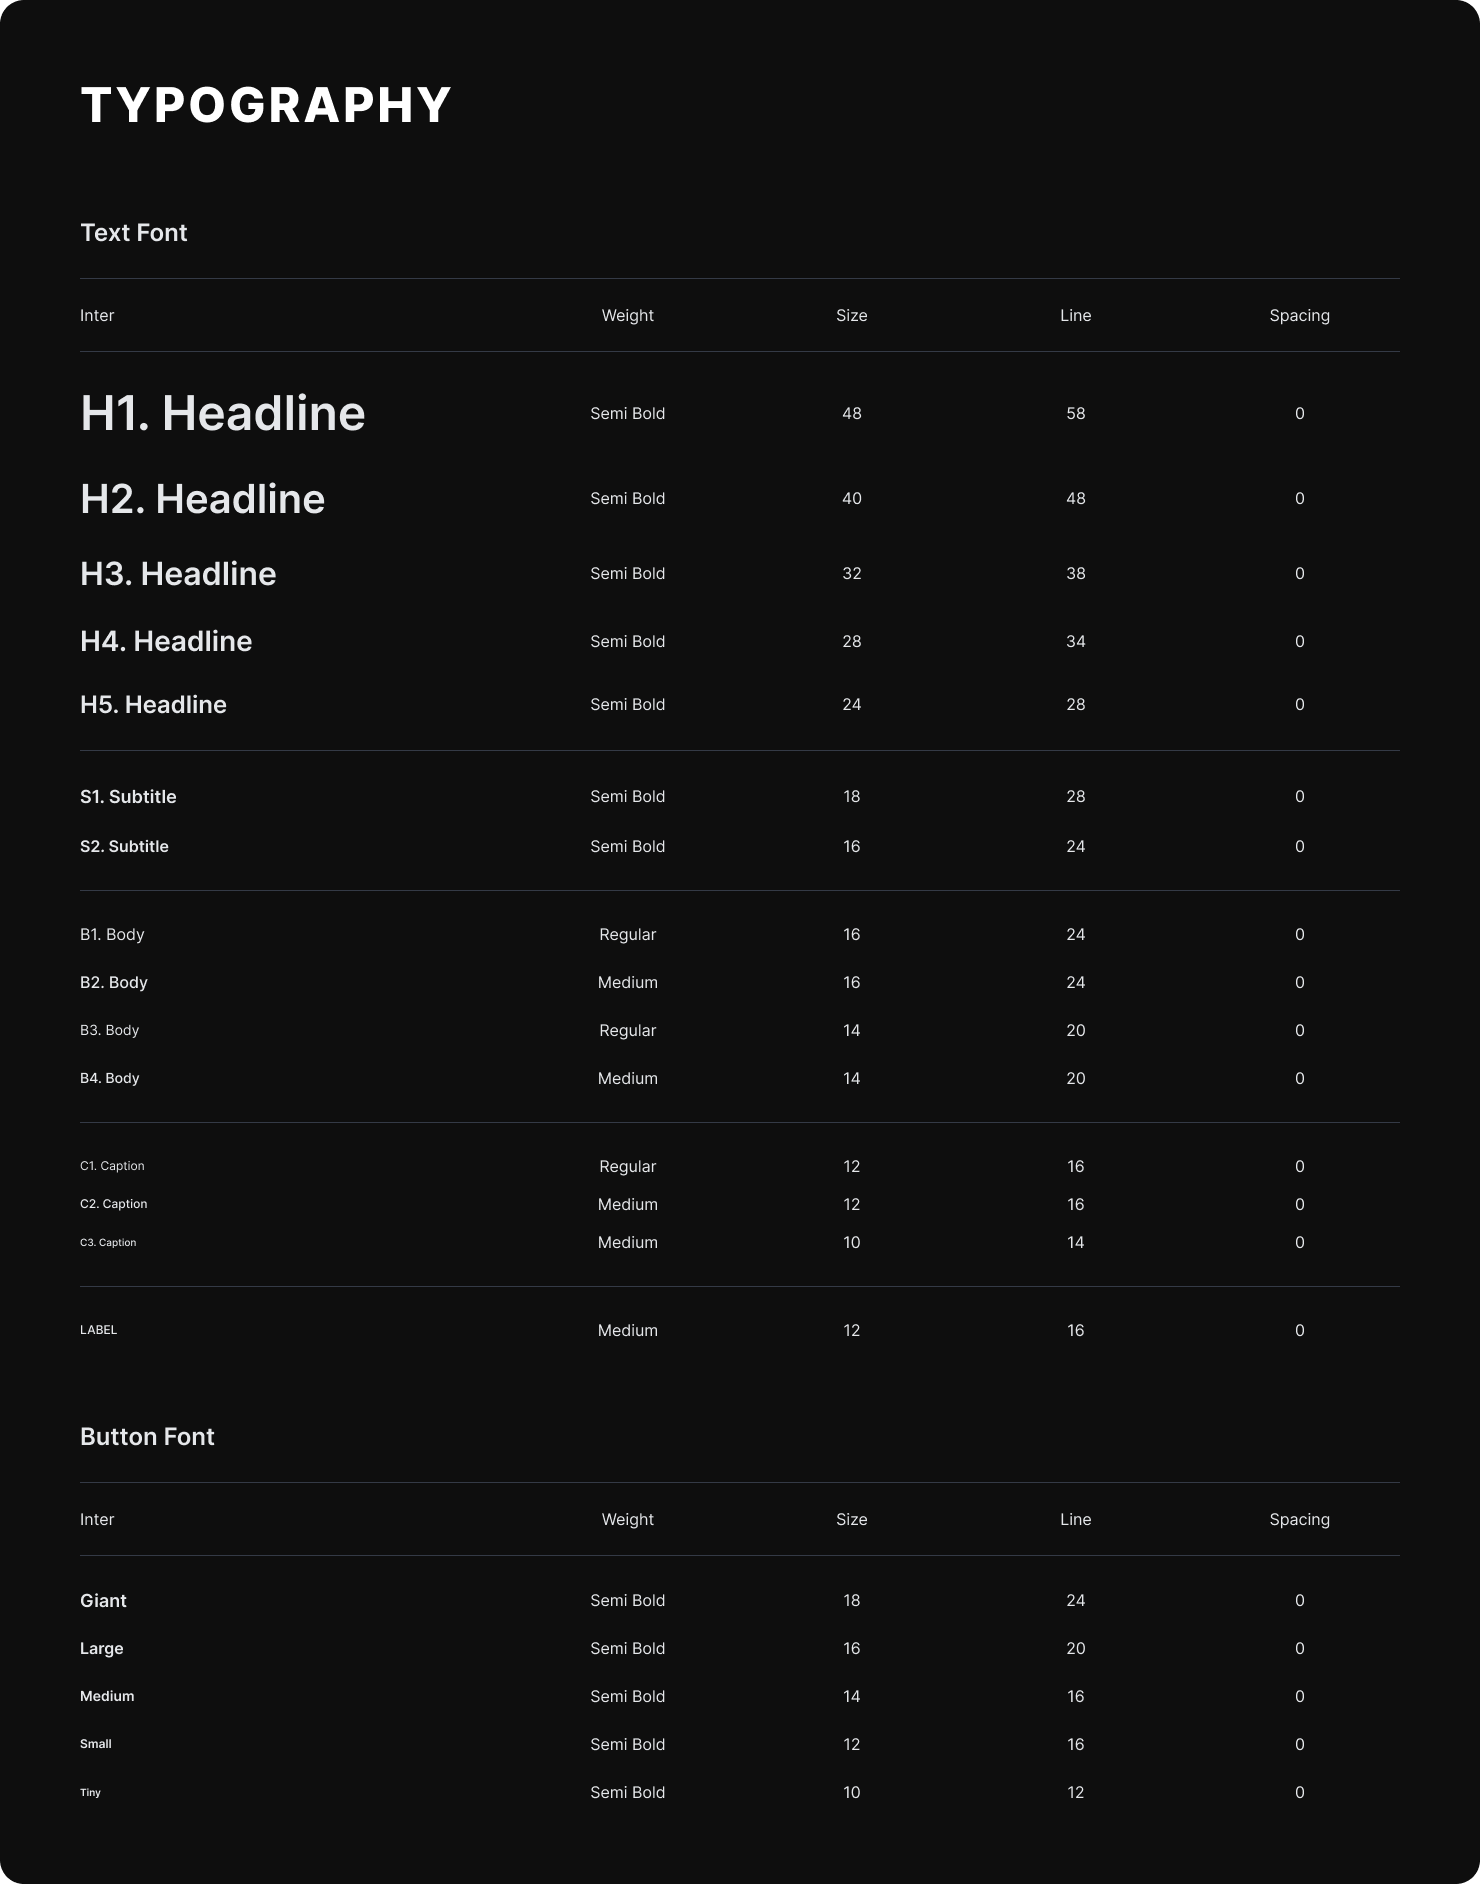
Brand & design system
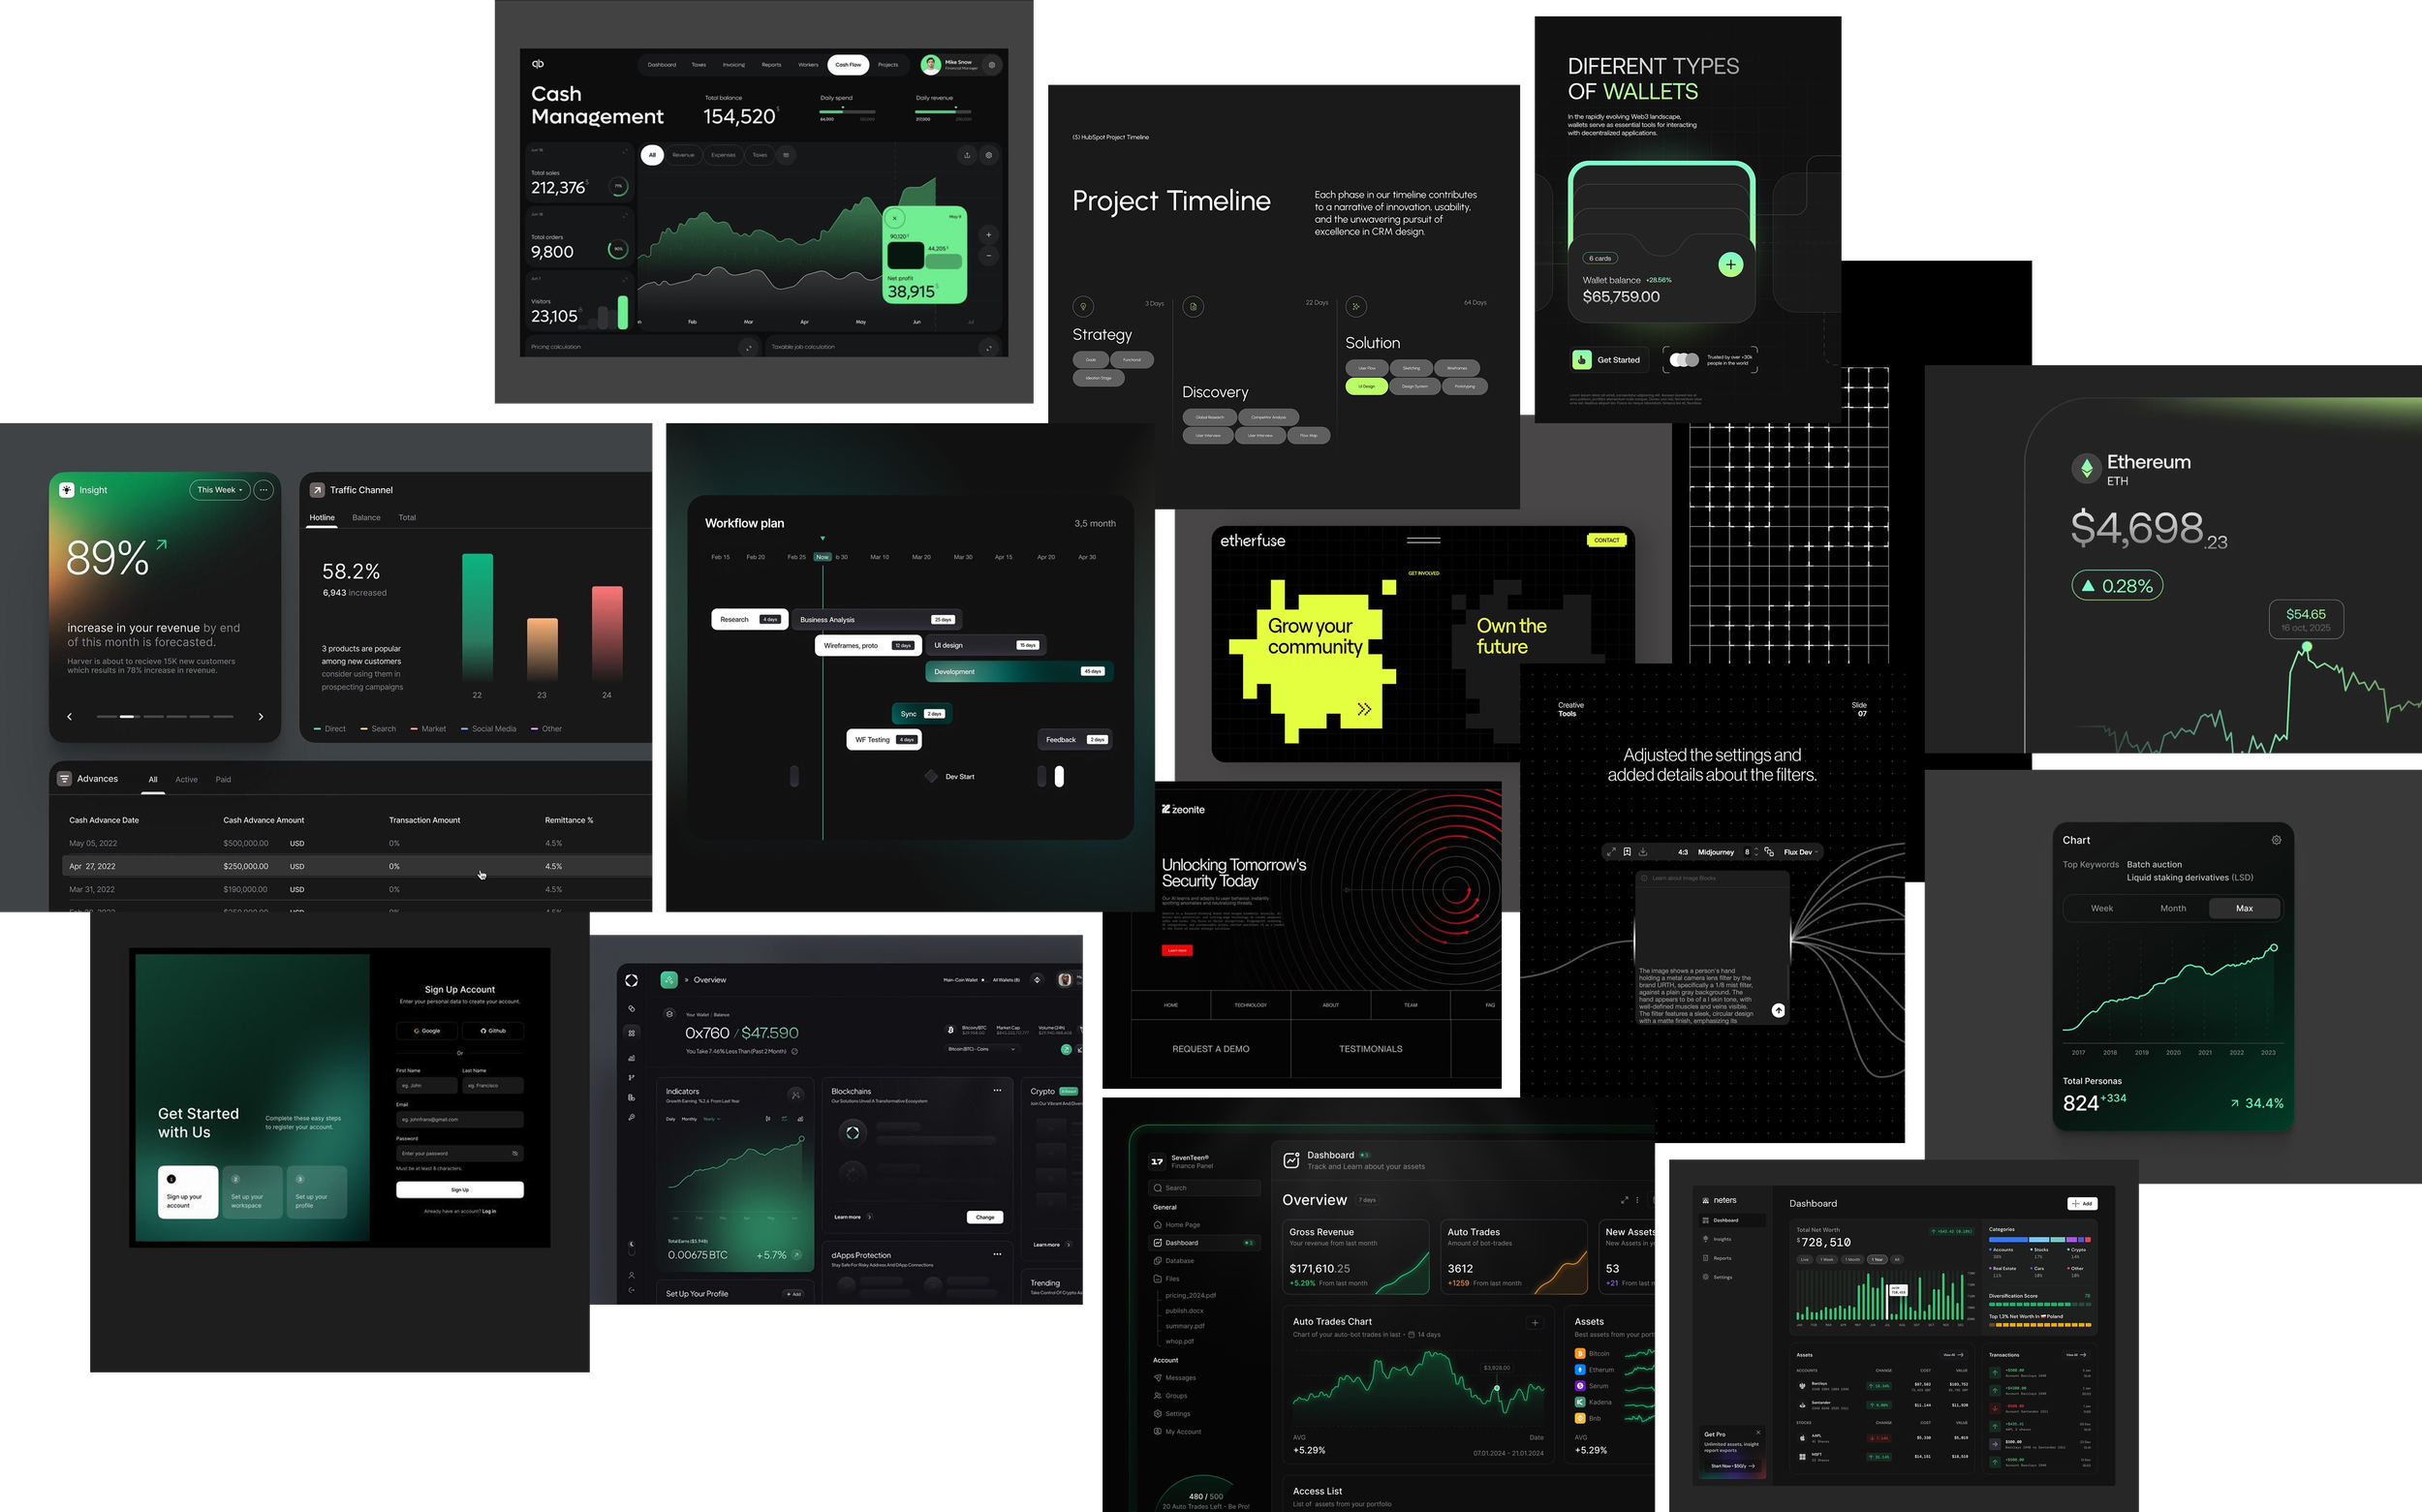
The overall aesthetic is minimal and data-forward with clean typography, high-contrast charts, and intuitive navigation. This streamlined approach feels contemporary, sharp, and aligned with the fast-paced nature of digital trading. Using these principles I created the foundations of the product’s design system.
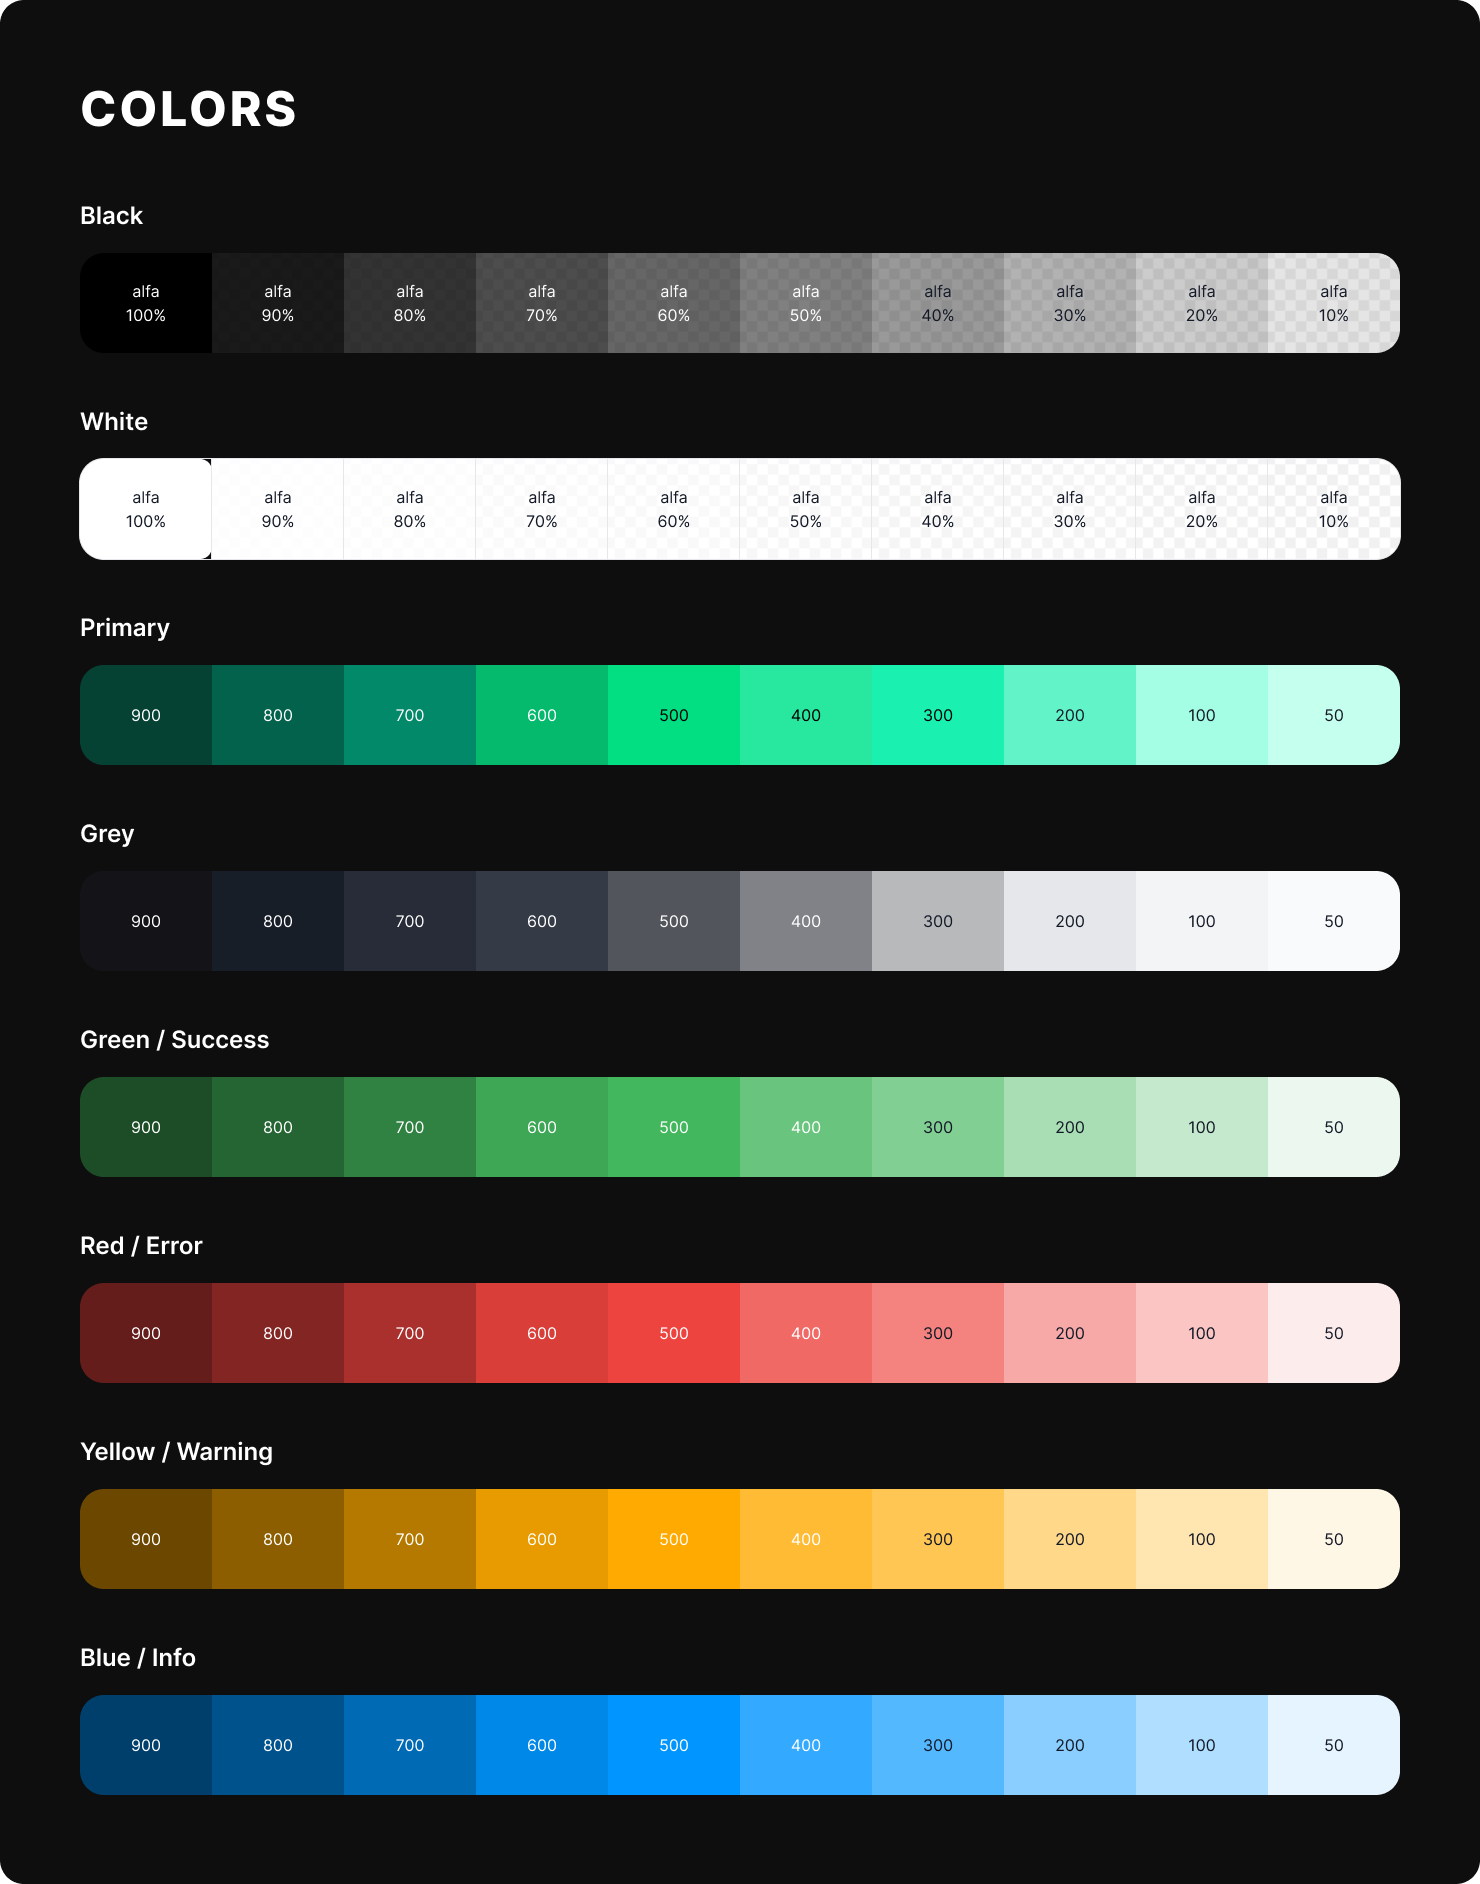
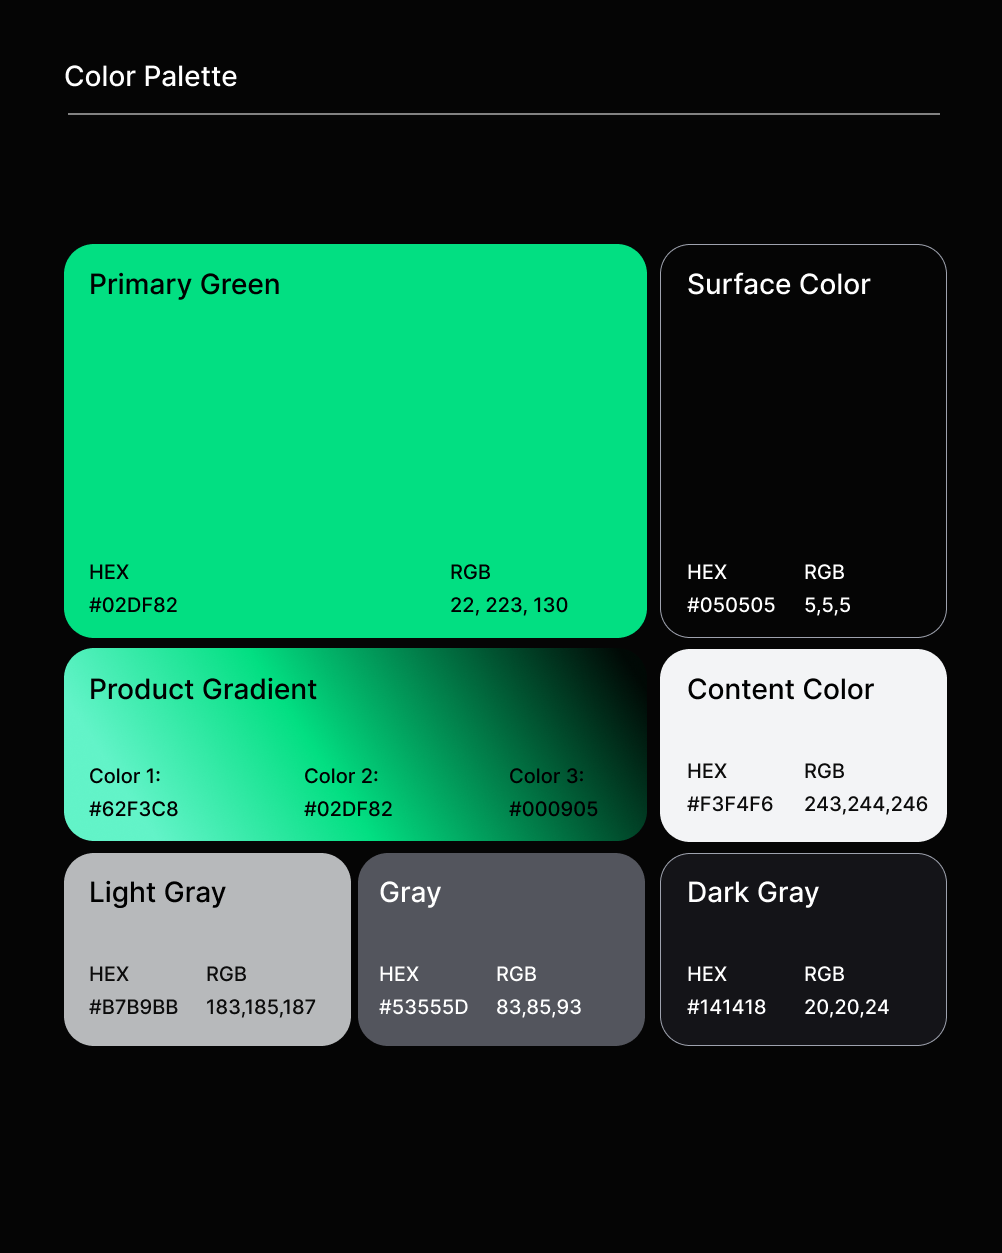
For the visual direction, I focused on building a cohesive visual identity that communicates clarity, precision, and modernity. Drawing inspiration from Robinhood’s clean interface language, the design system centers on a black and green color palette. The black establishes depth and authority, and green signifies growth, performance, and market movement.
EXPLORATION
Designing the Trading Interface
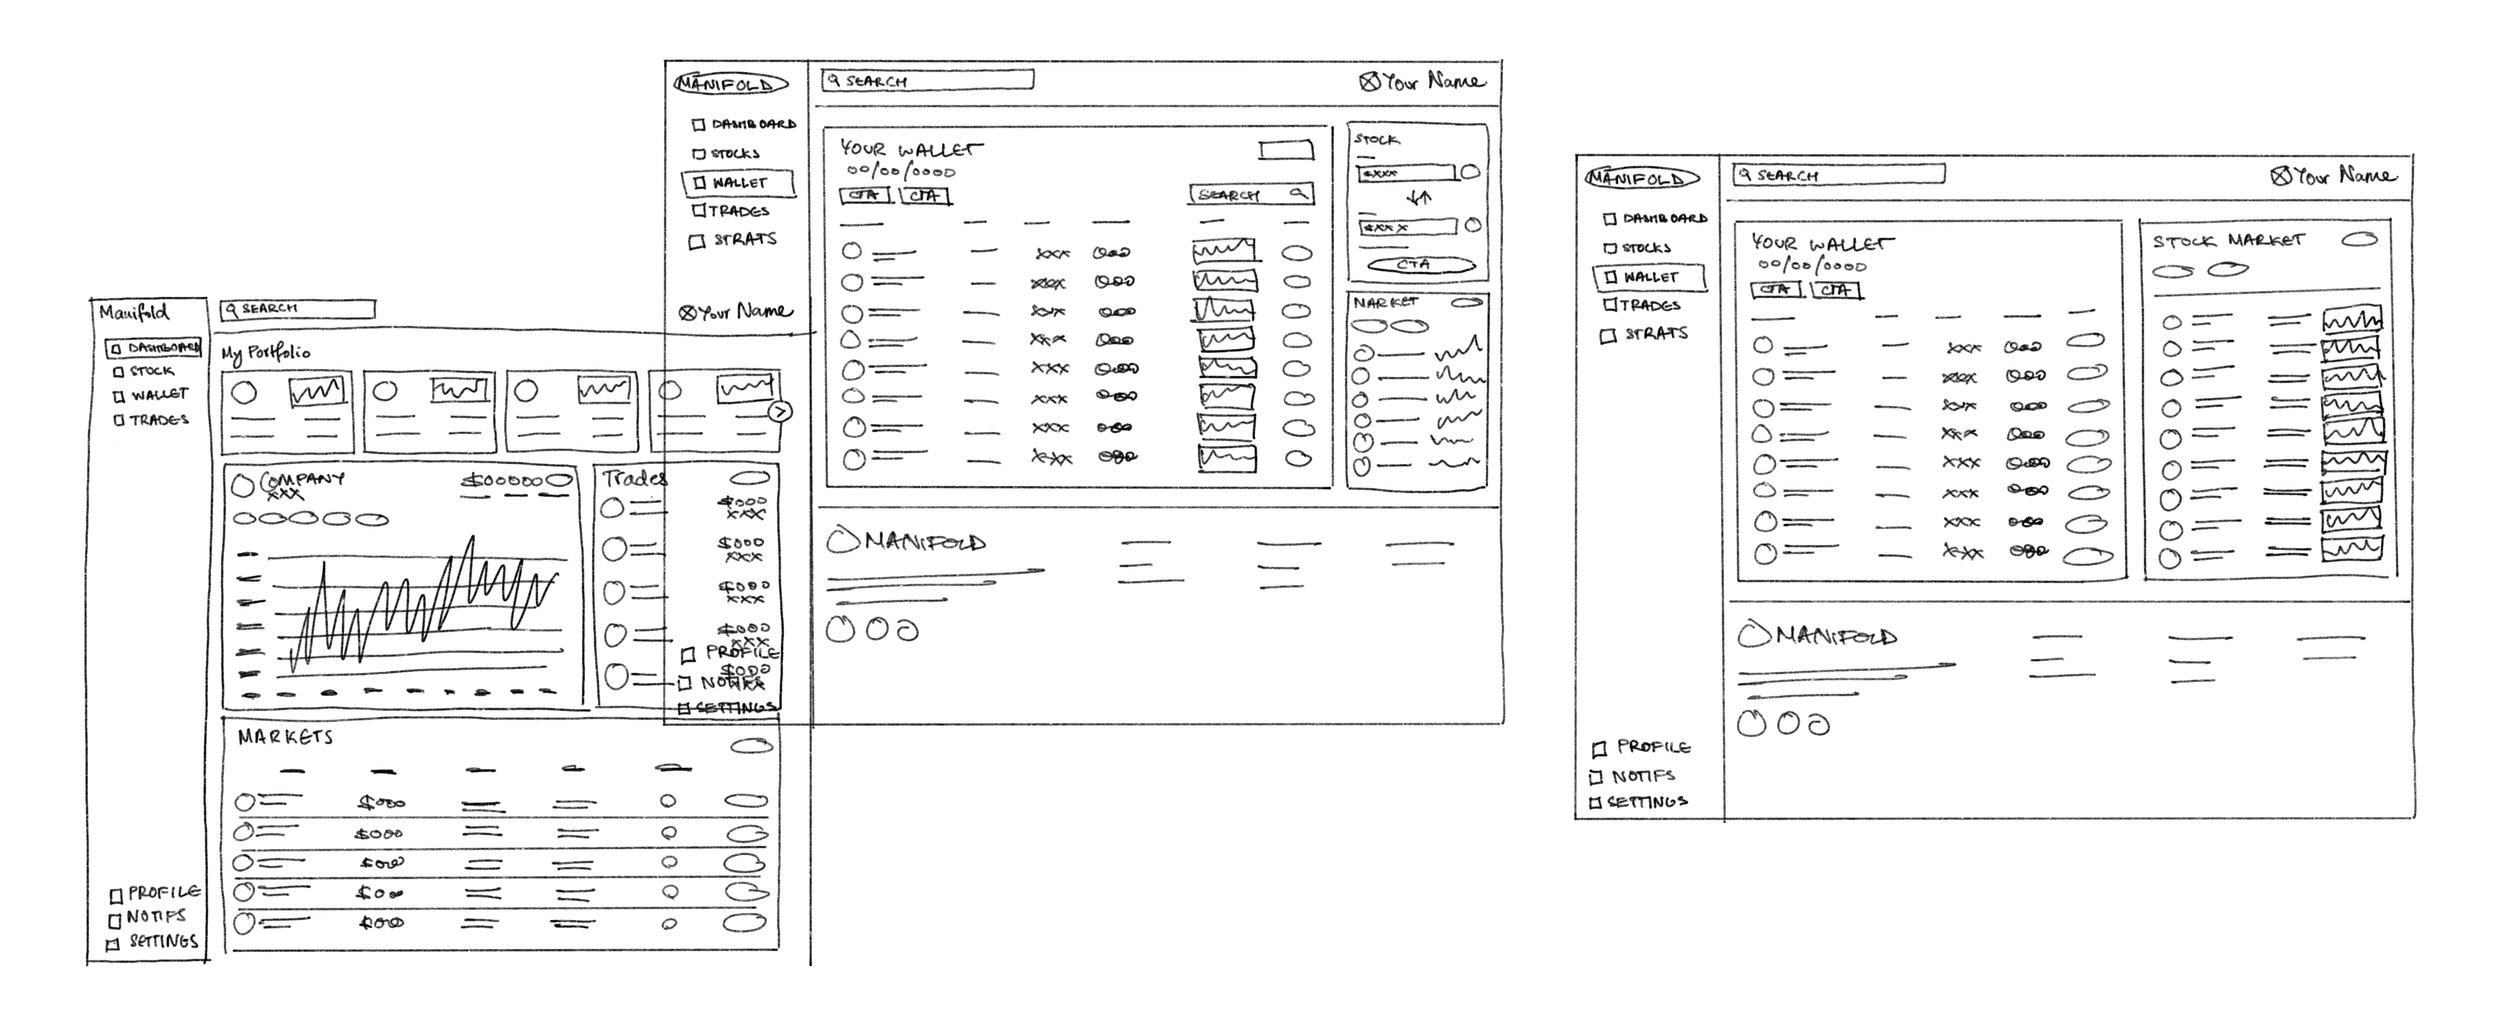
In this exploratory phase, the primary challenge was translating complex algorithmic trading strategies into a visual system that felt structured, readable, and intentional. Through low-fidelity sketching and wire-framing, I focused on defining the overall screen architecture and core component types before moving into high-fidelity design. The goal was to make dense financial data understandable while reducing cognitive strain and maintaining visual rhythm across the interface.
Key decisions included introducing modular data cards to segment complexity, establishing a strong grid system to anchor the layout, and creating a clear hierarchy within charts and metrics. By minimizing visual distractions and layering information strategically, the interface allows traders to drill deeper into data only when needed, rather than overwhelming them with continuous streams of information.
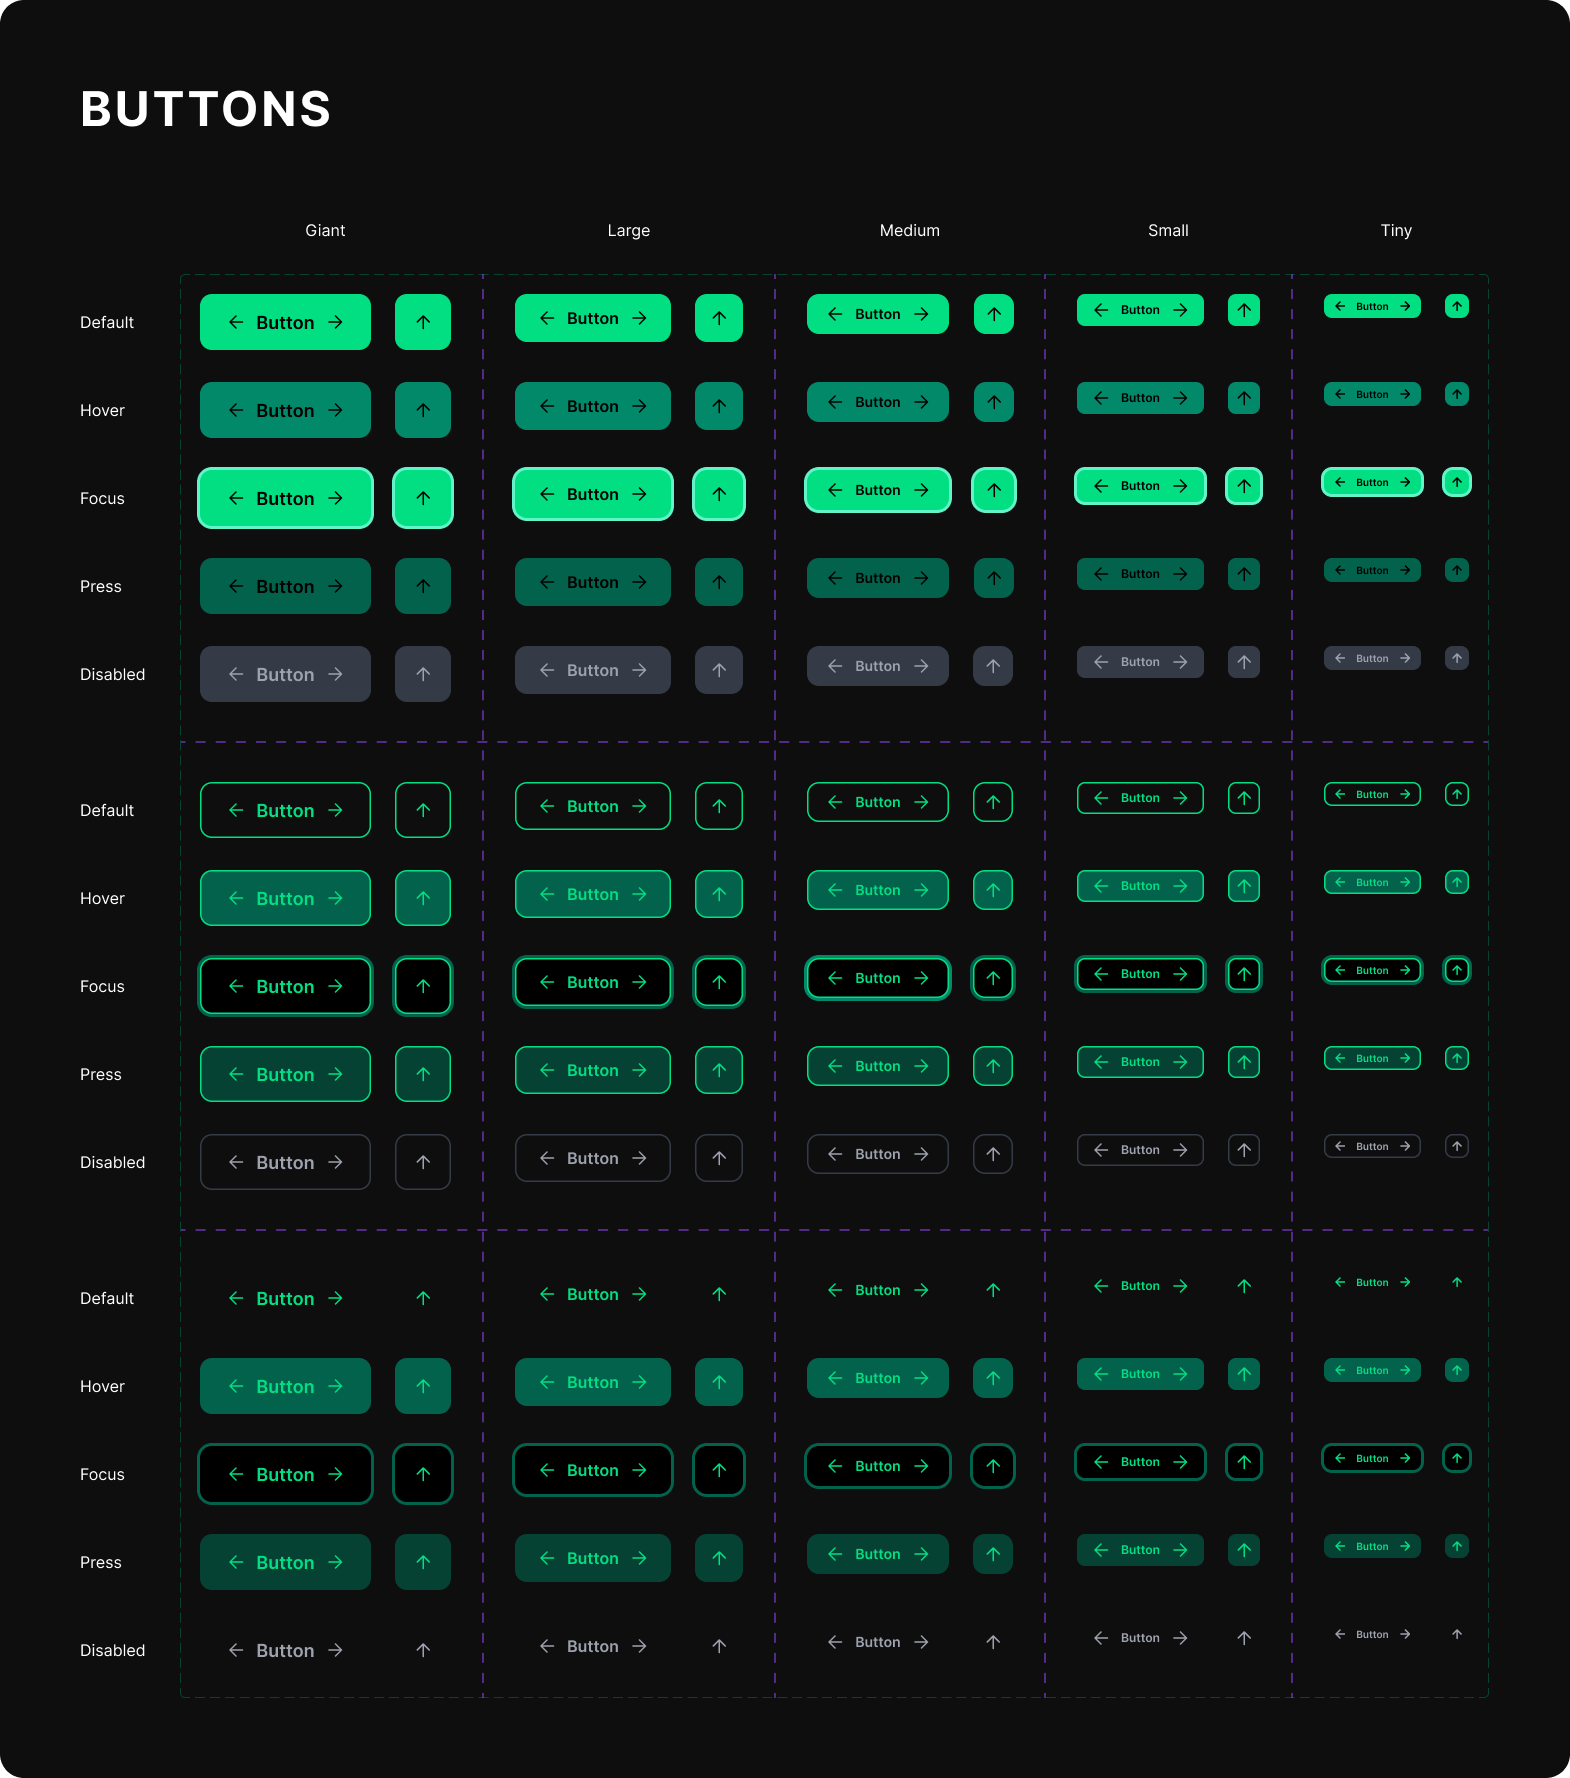
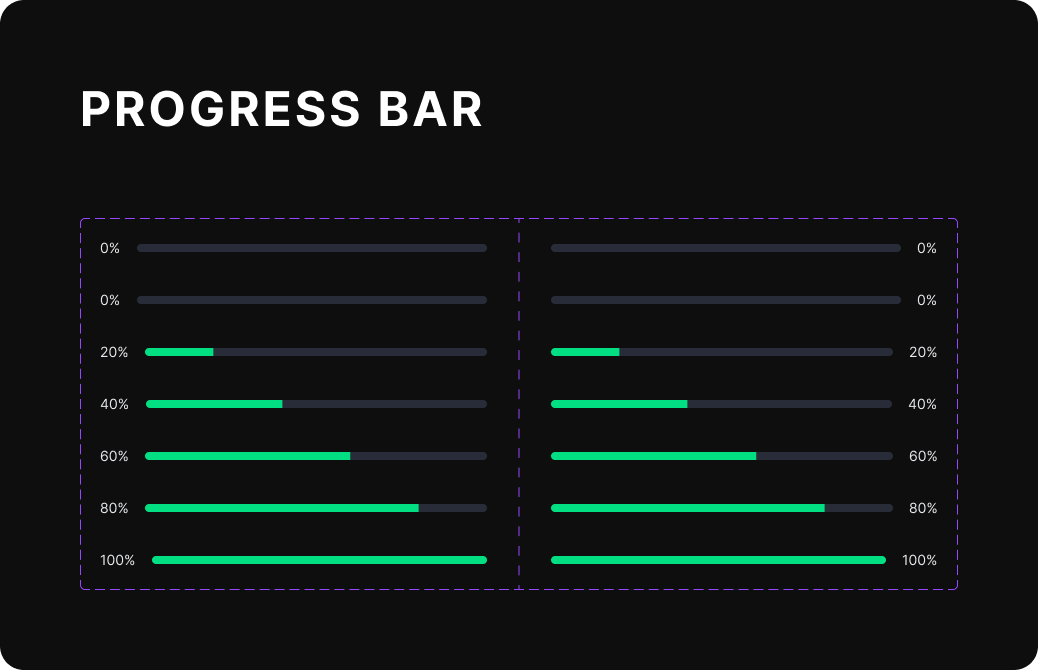
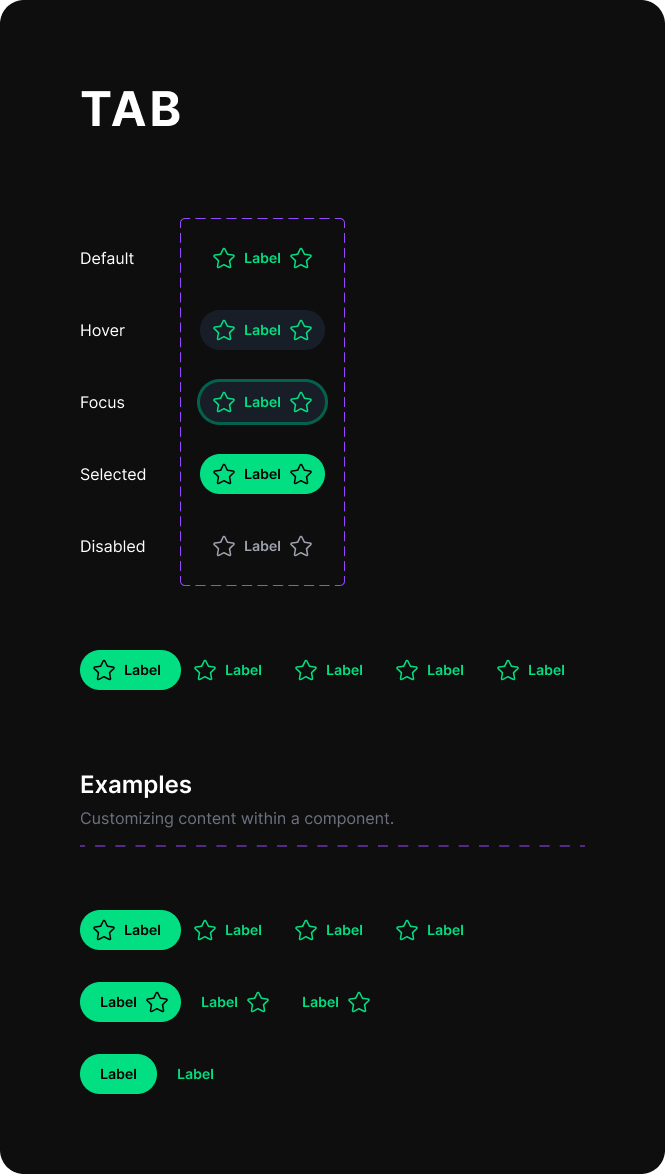
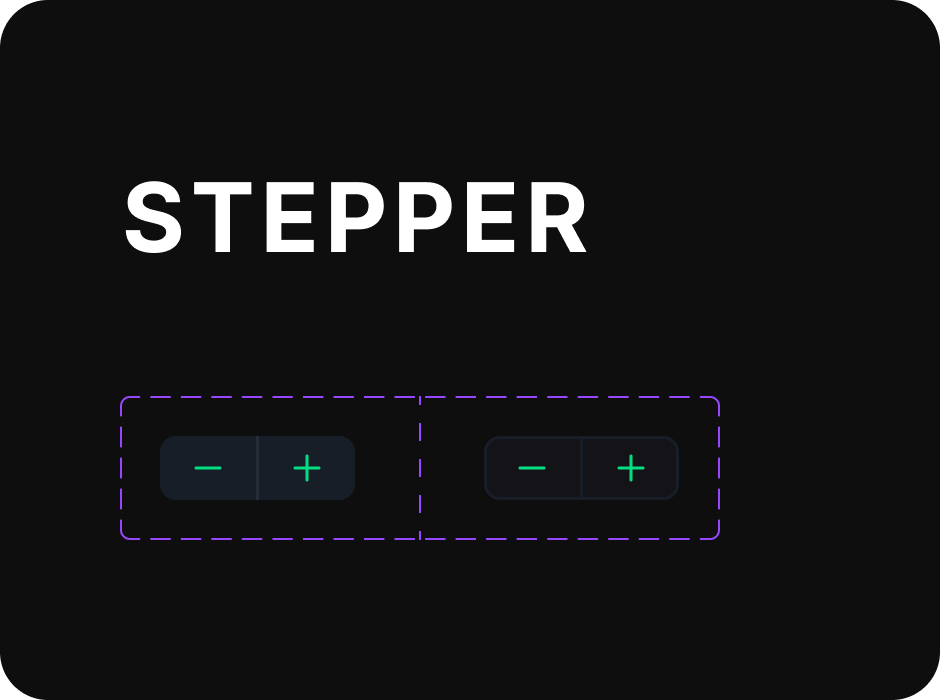
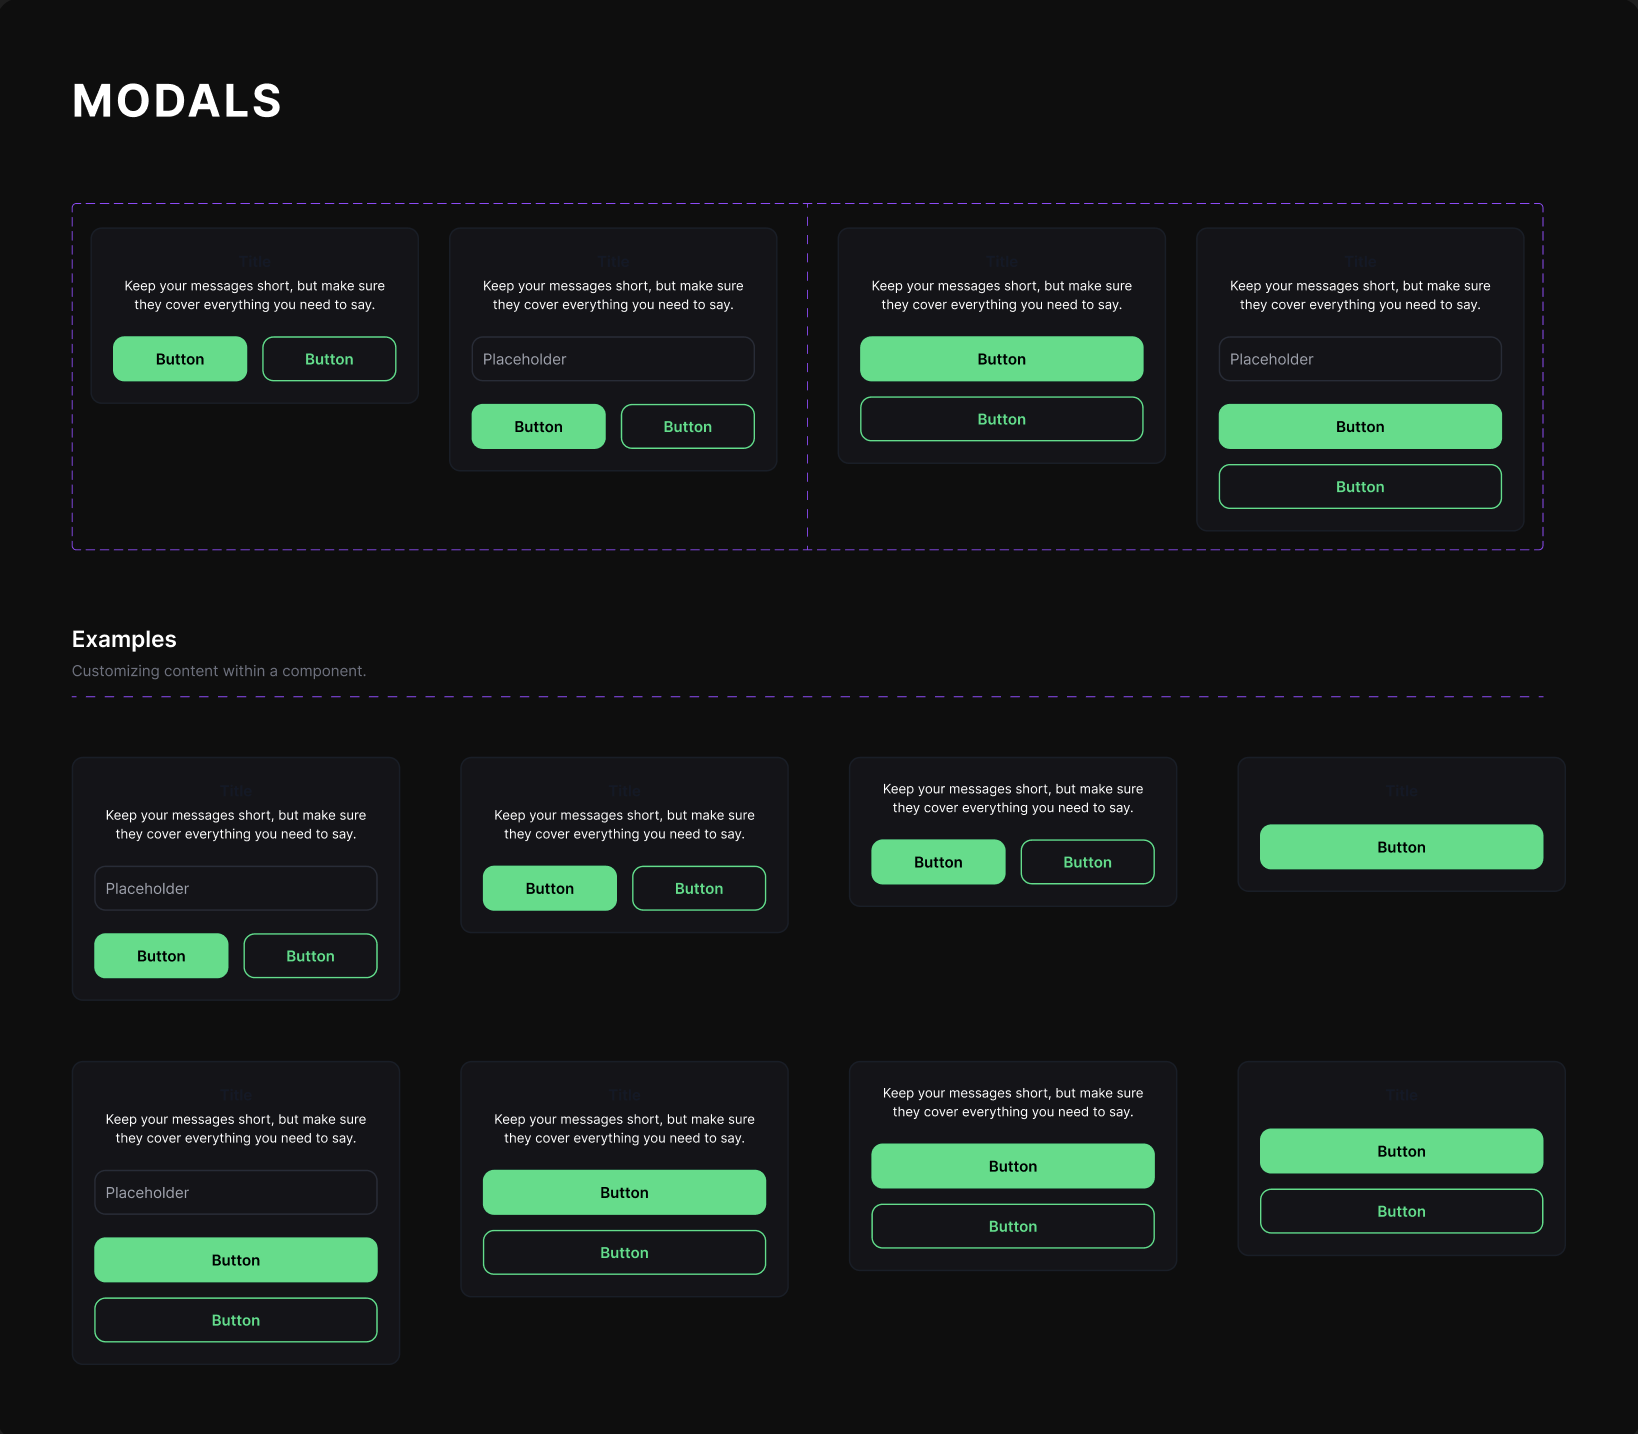
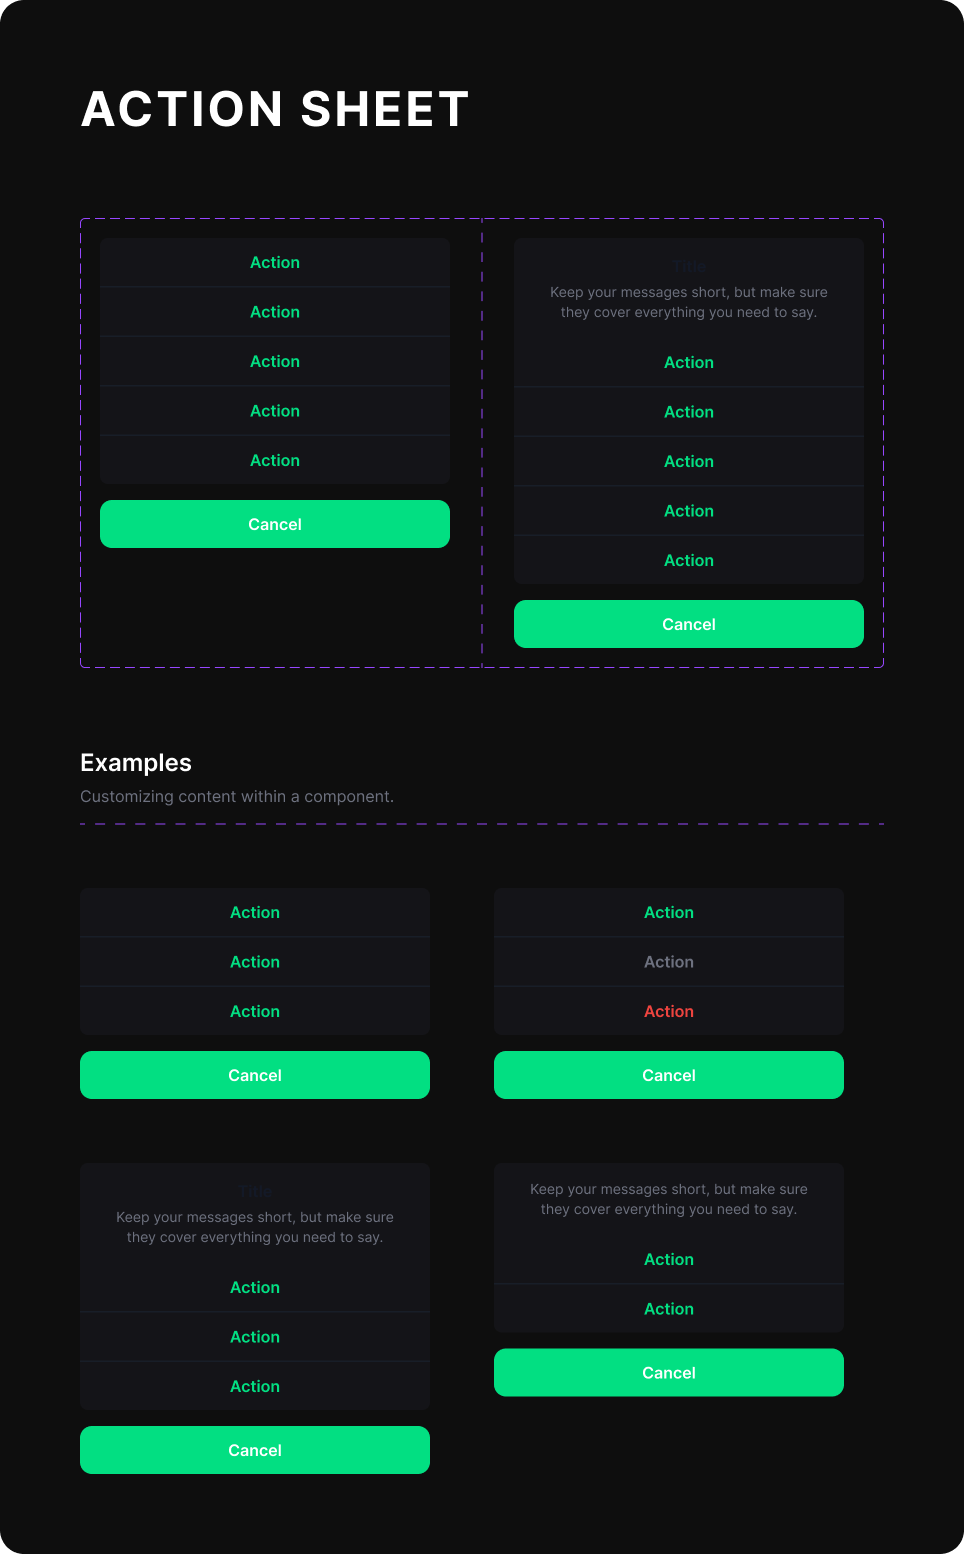
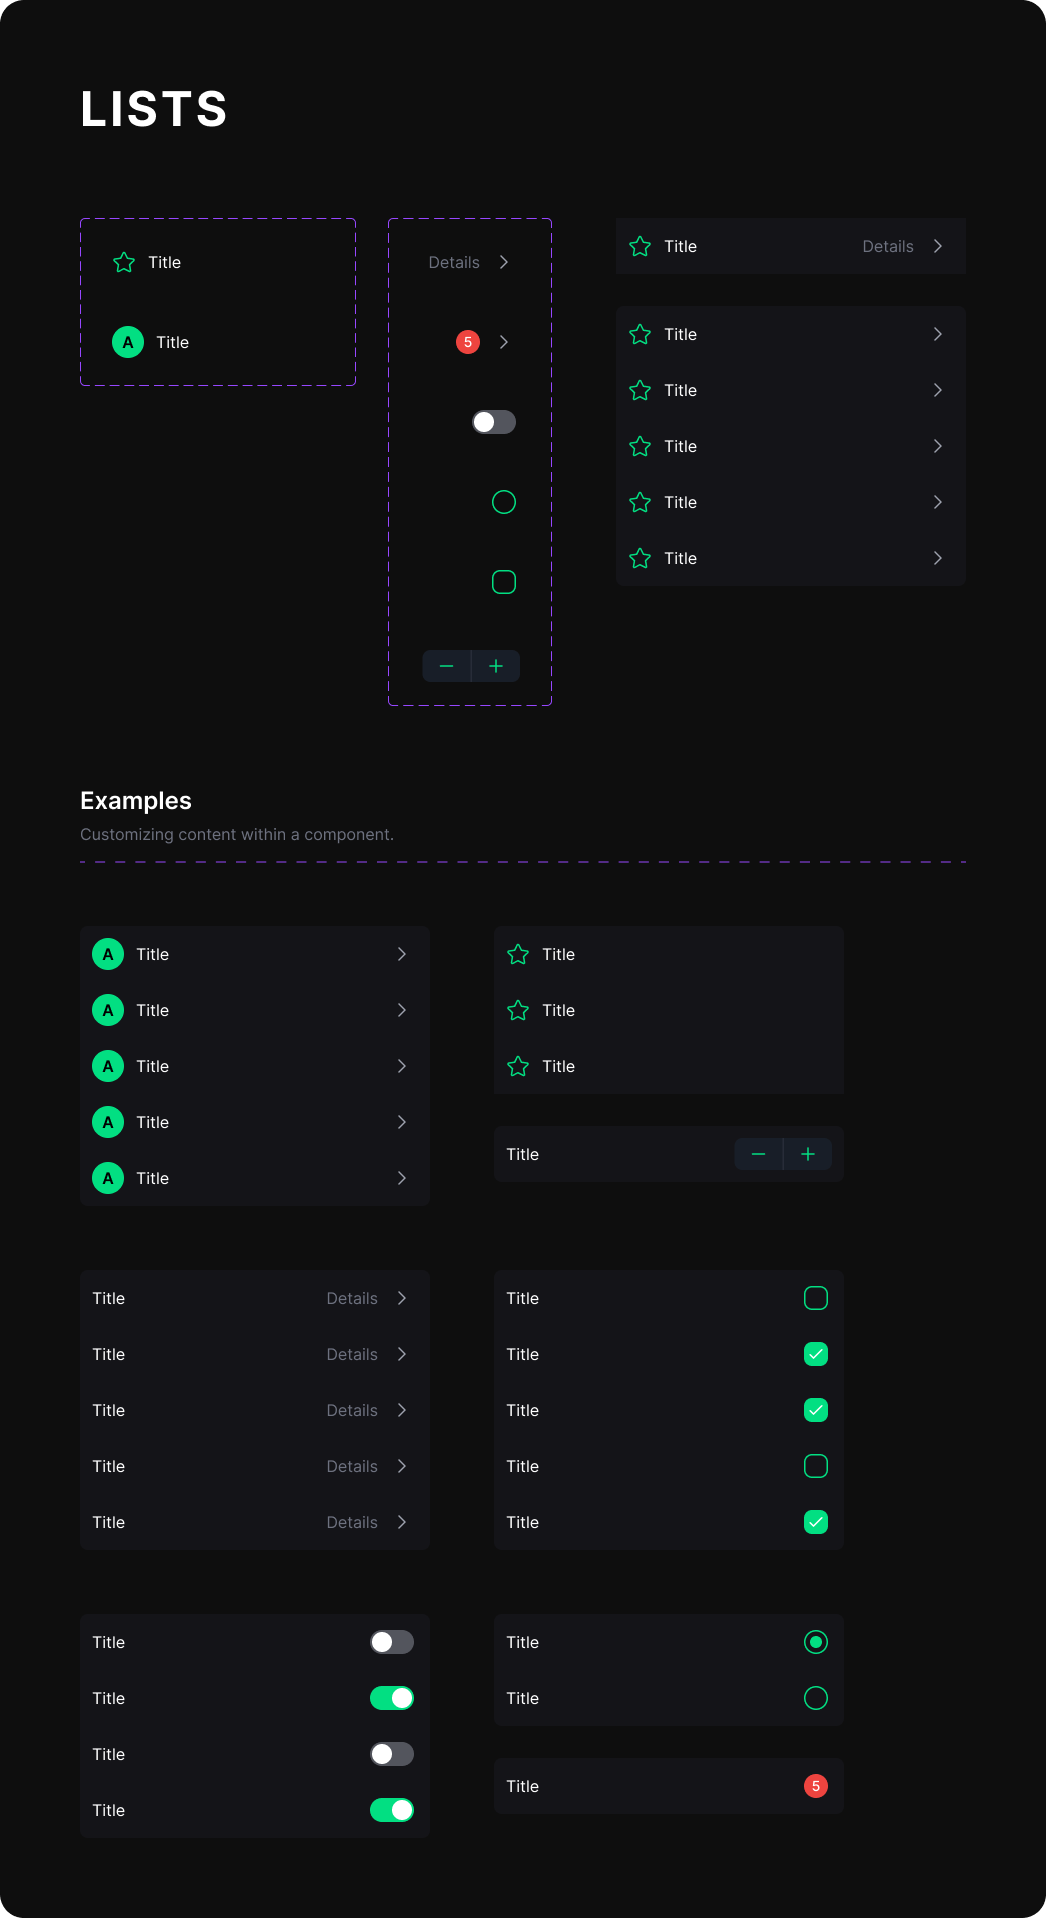
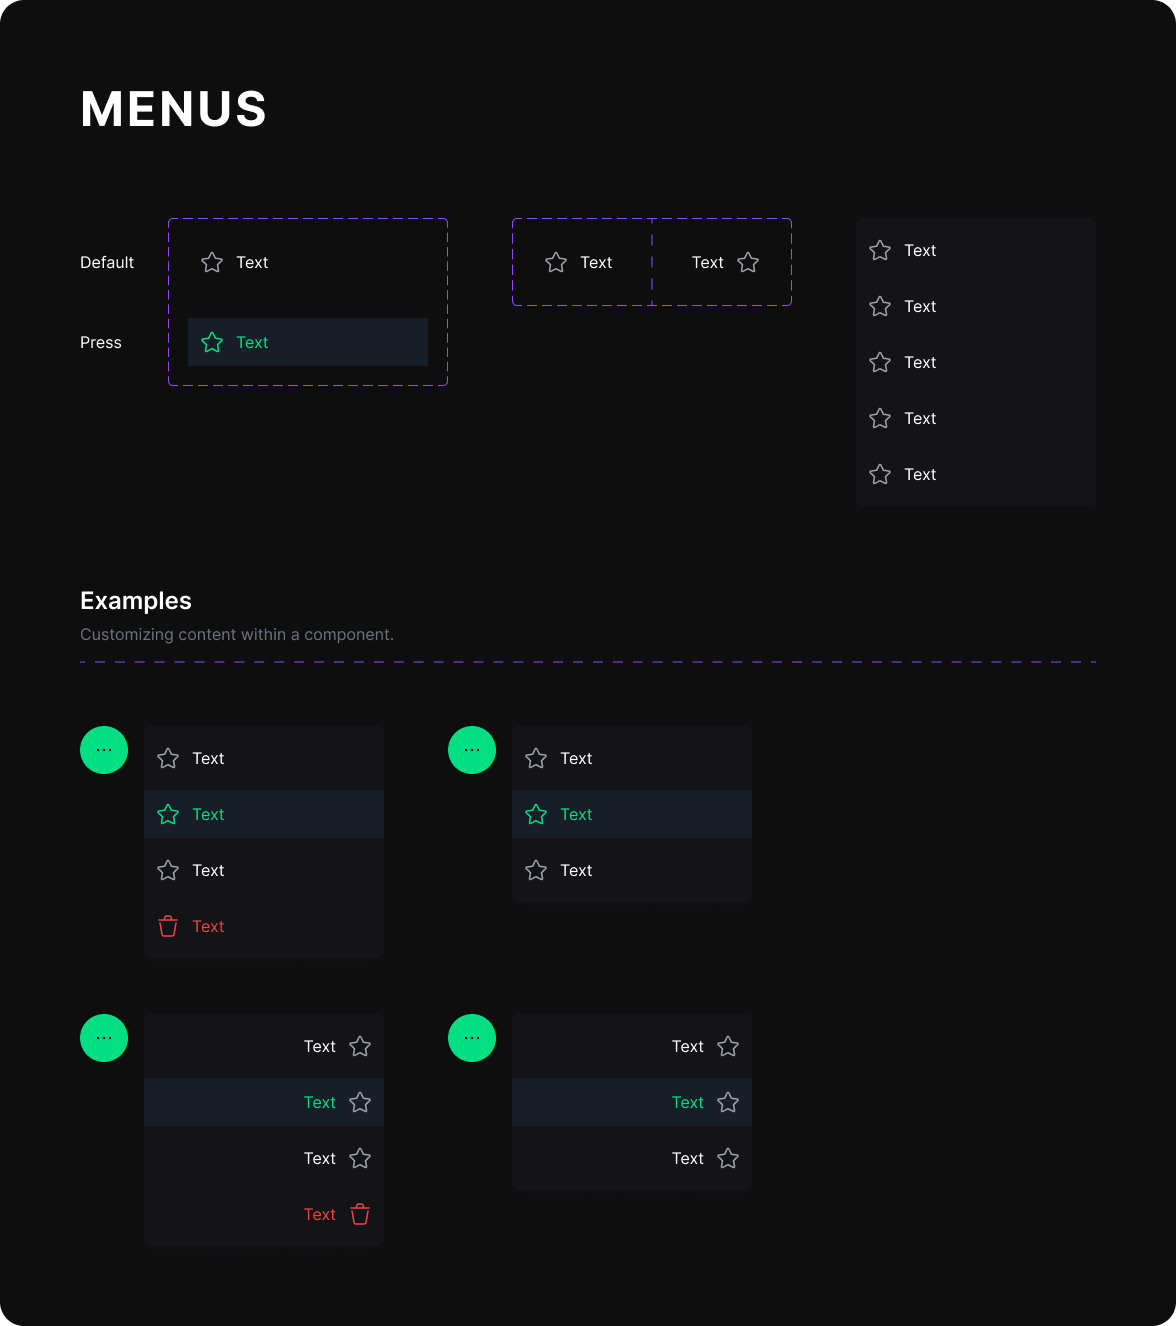
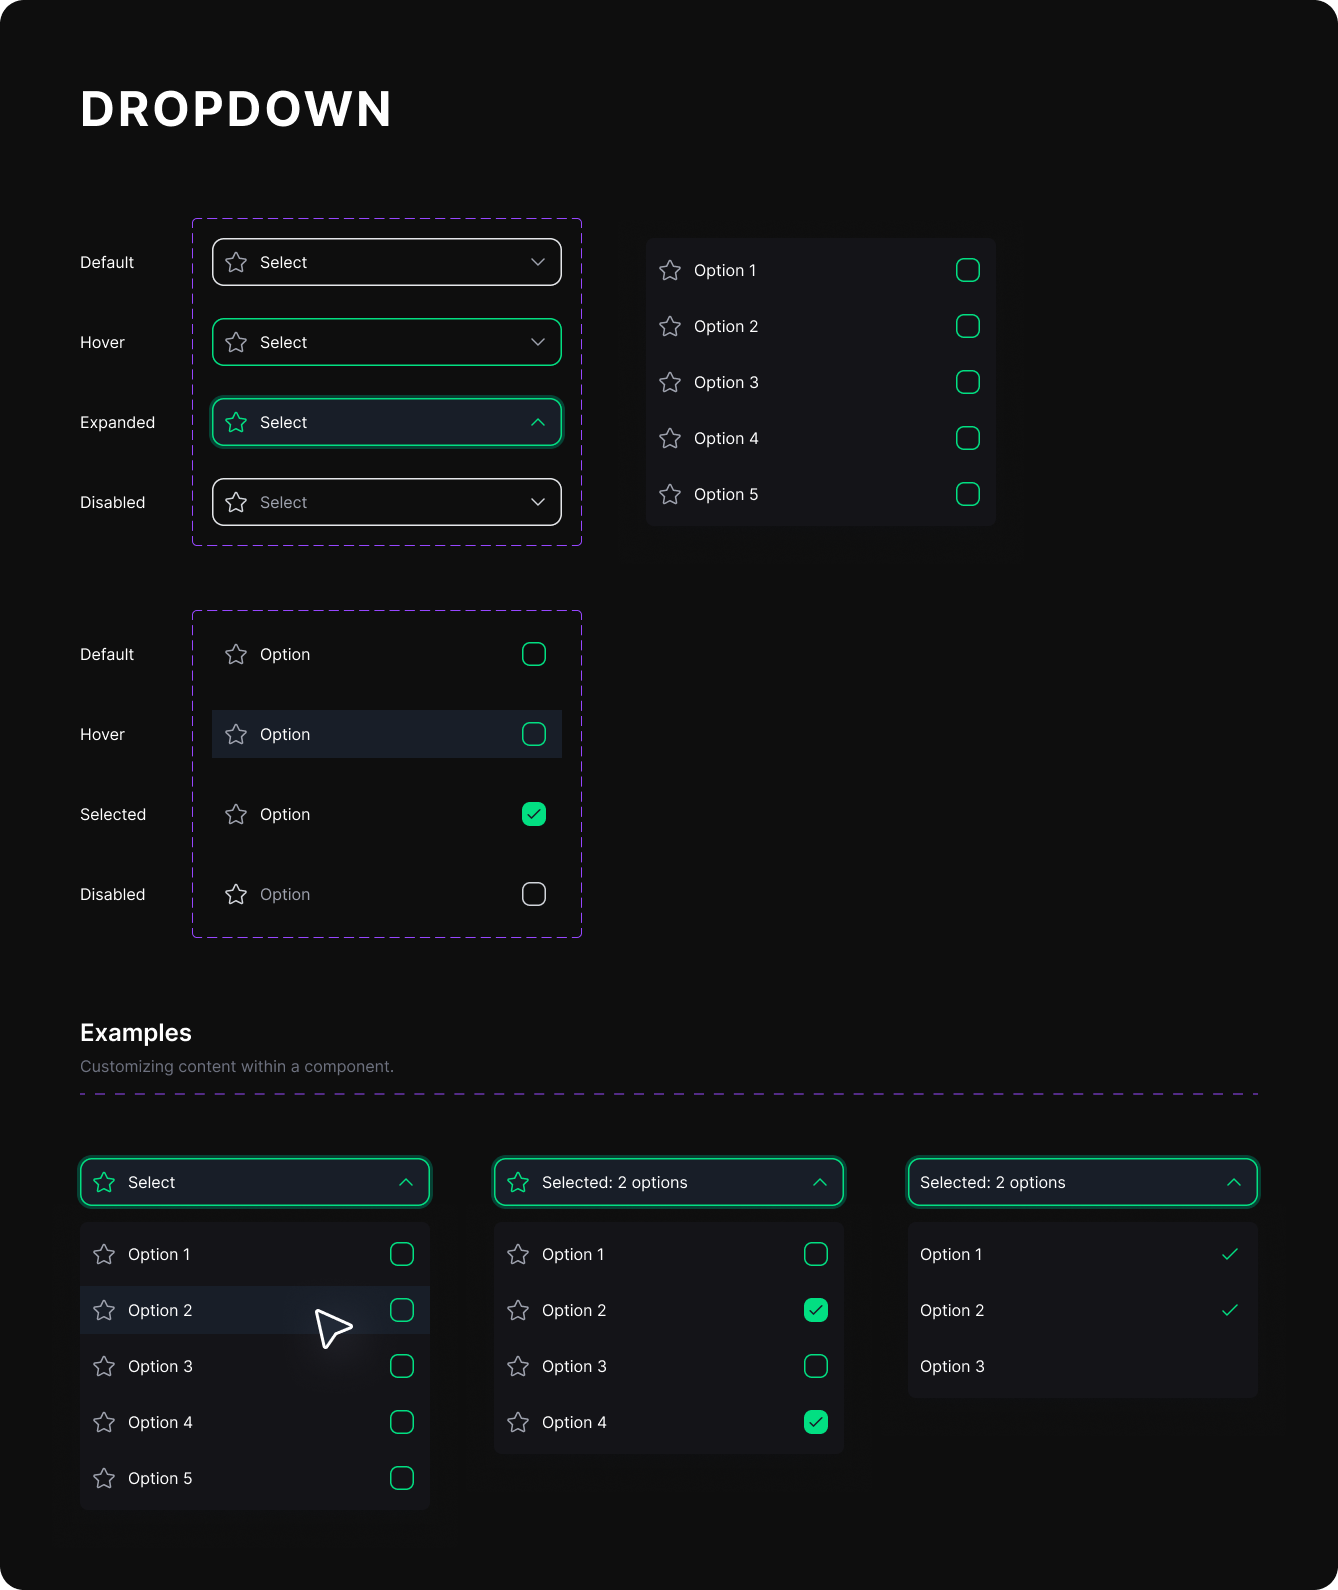
COMPONENT DESIGNS

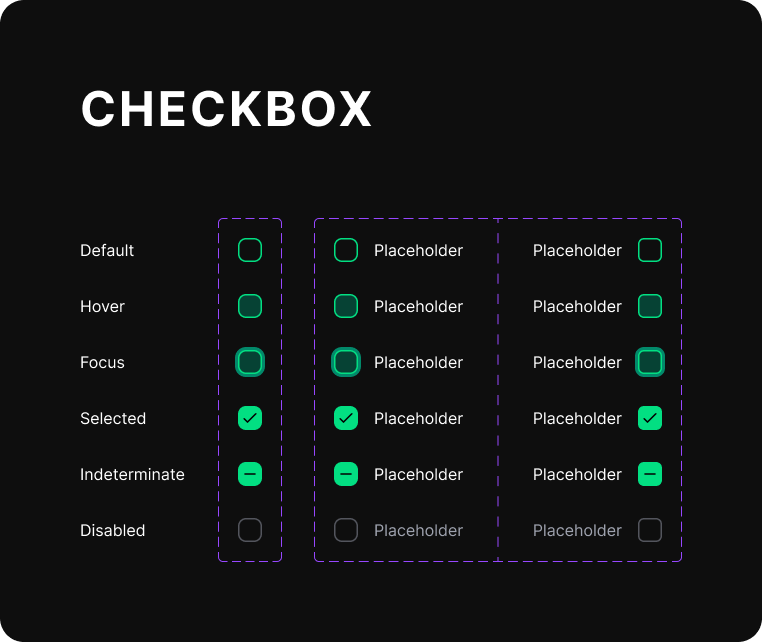
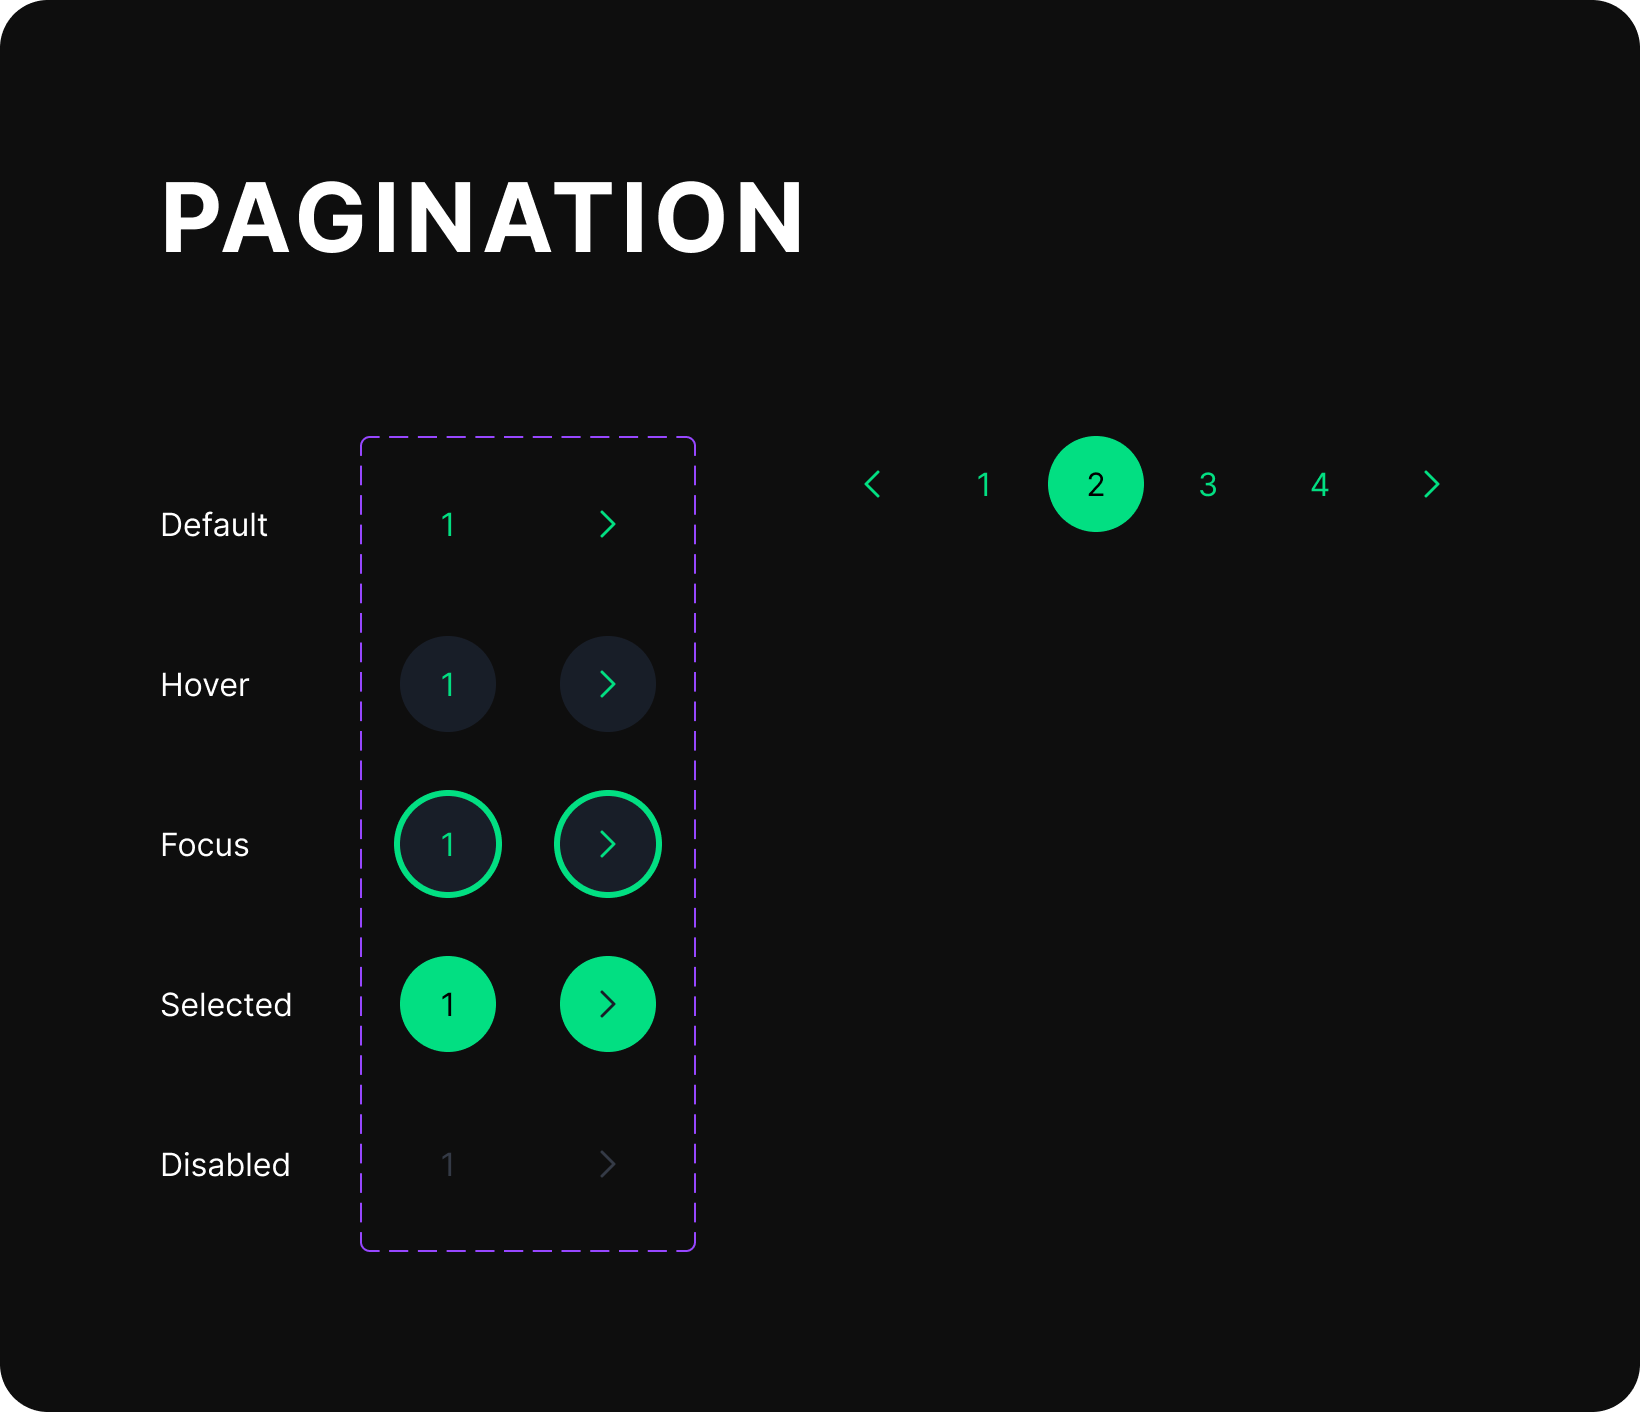
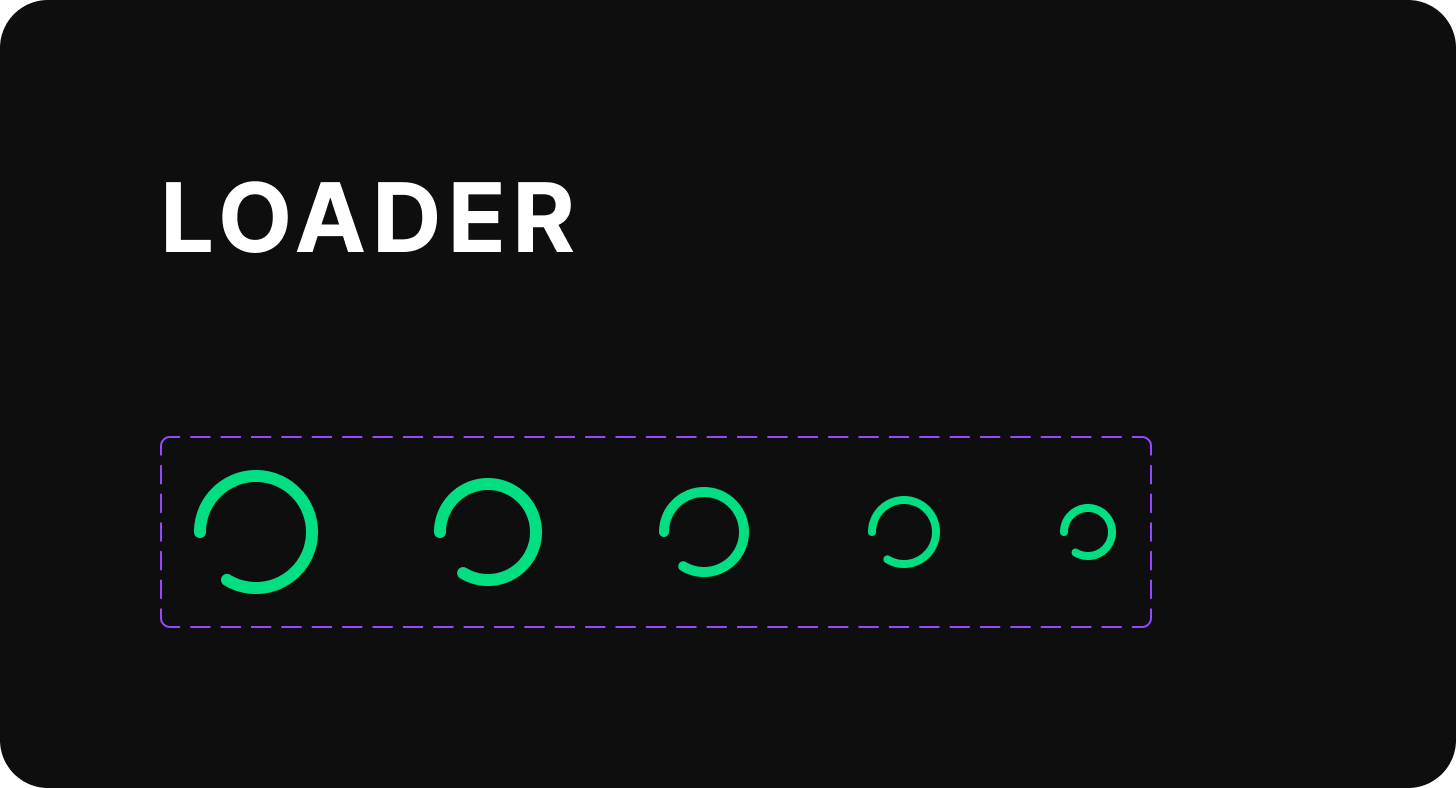
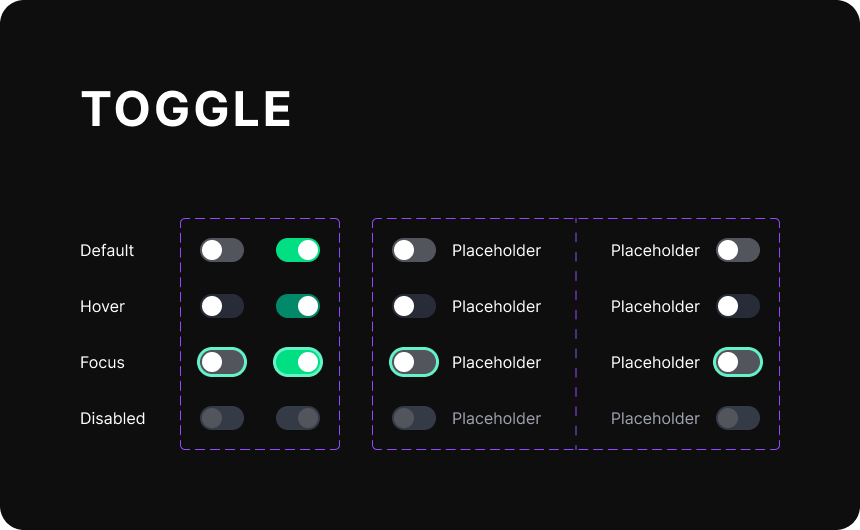
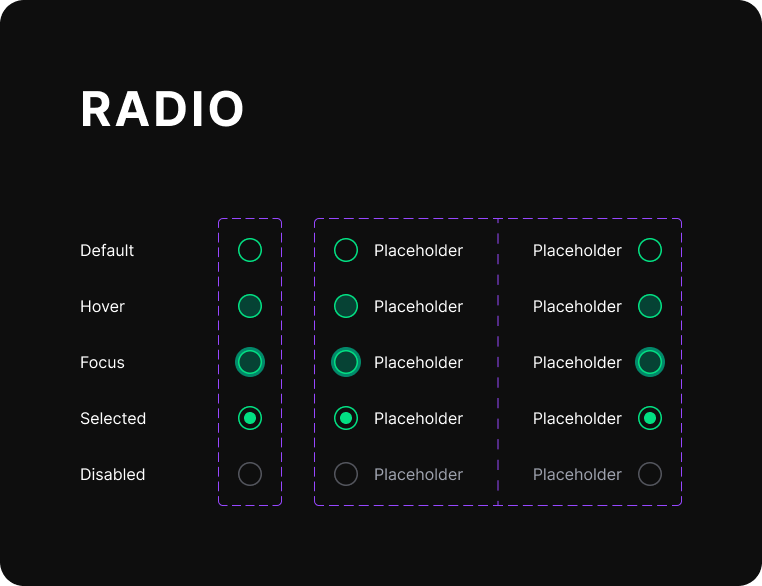
minimalist
adaptive
moDular
Having finalized the design direction and approach for the data screens, I moved on to flesh out the larger components and component groups. I kept these consistent and in line with the design system foundations that I had already established, while creating enough variants per component for plenty of flexibility for the client needs.
data visualization
ADAPTIVE DESIGN
The Challenge: Data Density vs. Minimalist UI The most significant hurdle was "The Data Paradox." Quantitative traders need all the data, but designers want less clutter.
Solution: I implemented Progressive Disclosure. The UI displays "Macro" trends by default, but uses hover-states and expandable drawers to reveal "Micro" data points. This maintained a clean aesthetic without hindering the traders' ability to audit the algorithms.
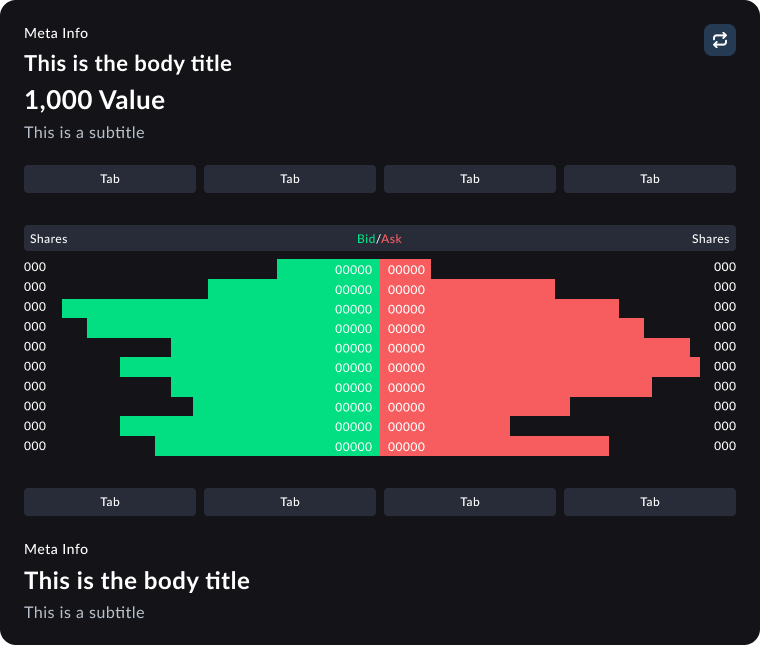
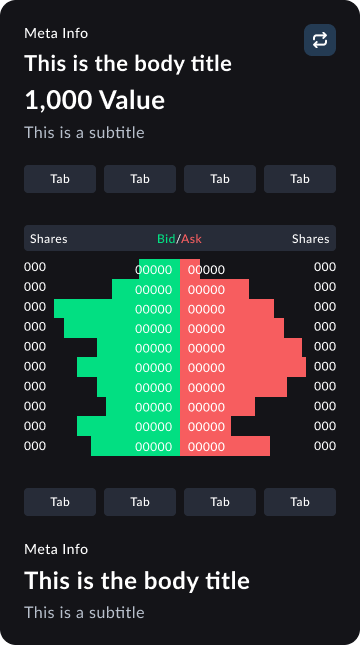
data DESIGNS
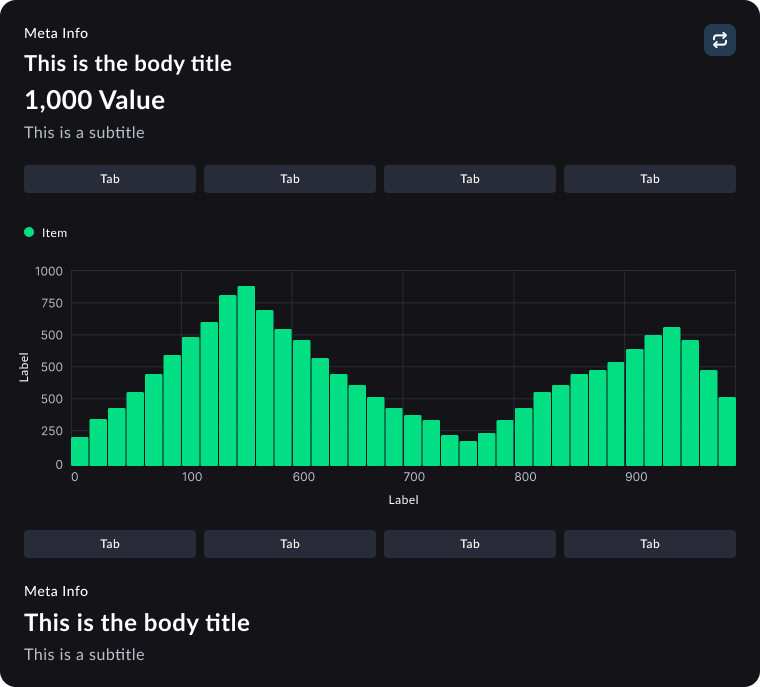
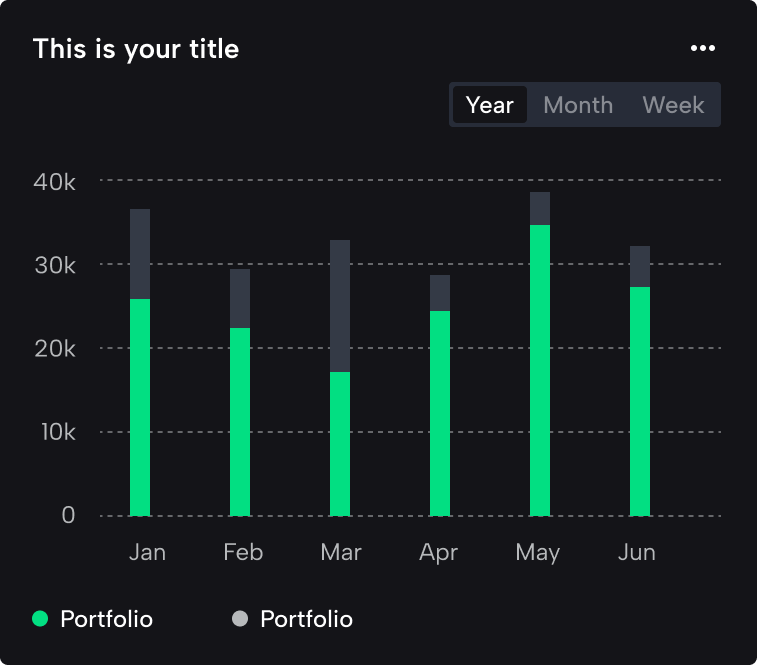
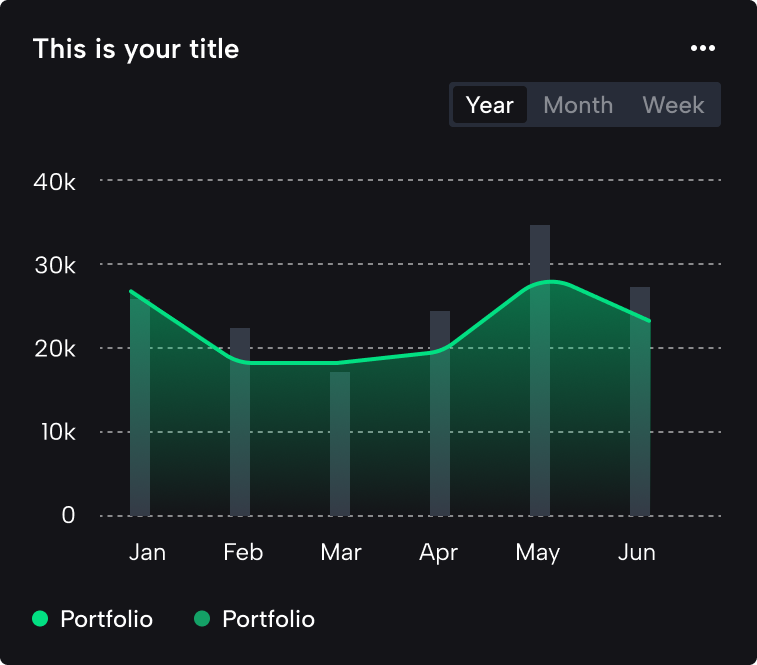
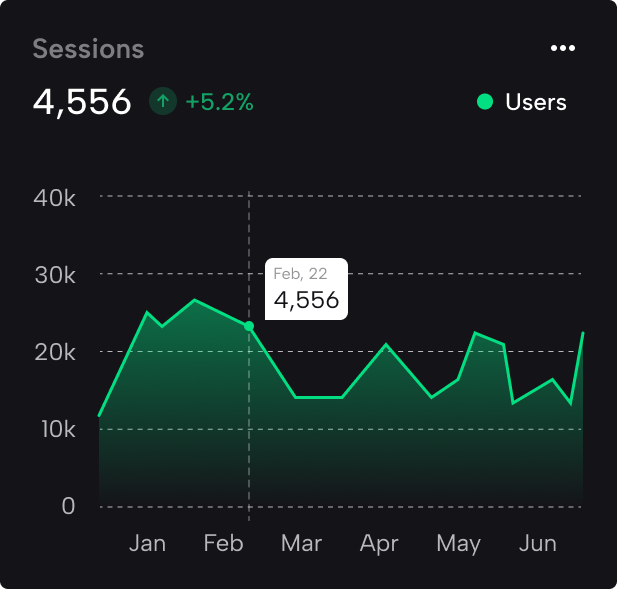
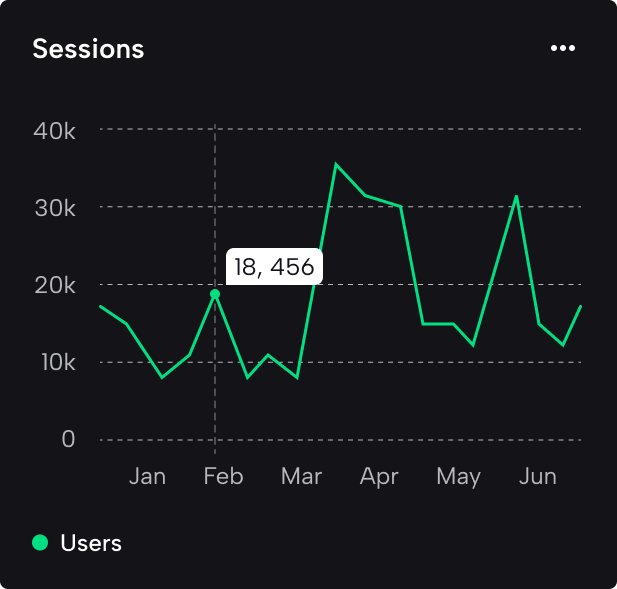
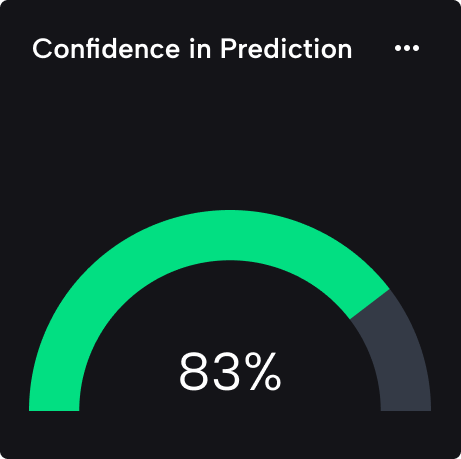
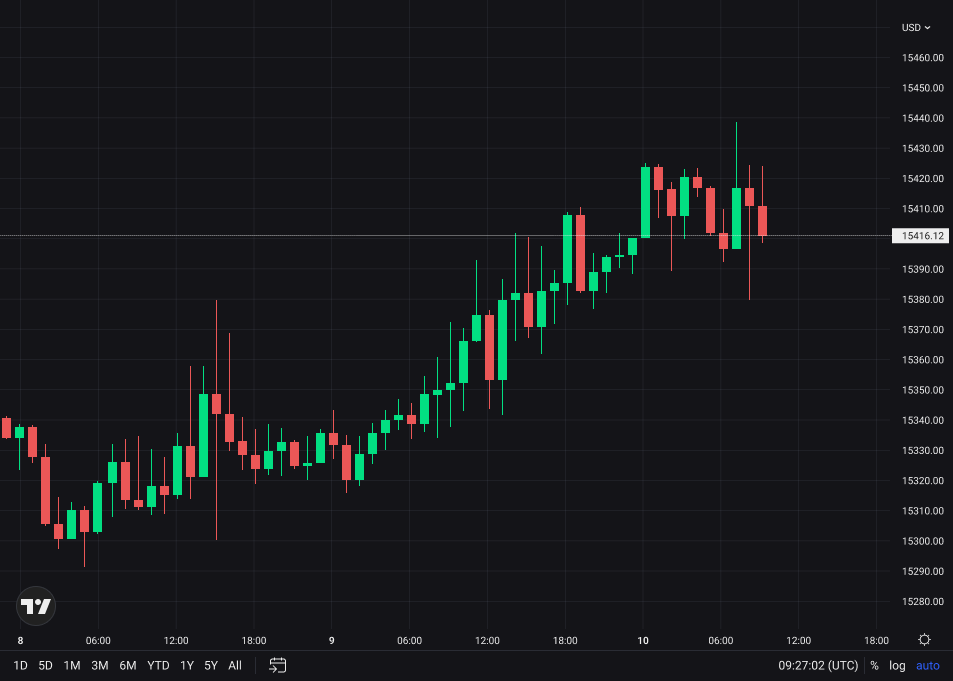
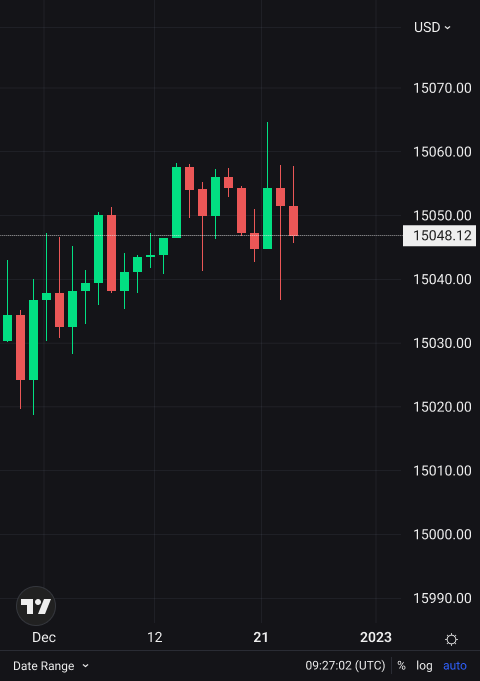
For the data visualization system, I experimented with multiple chart types and layout variations to match the different ways traders interpret strategy performance. I explored line charts, area charts, bar charts, stacked bars, and histogram-style distributions to represent everything from time-based growth and drawdowns to volume, consistency, and spread of outcomes. I also tested summary-first modules such as KPI cards and gauge-style indicators to communicate confidence or health at a glance, then paired them with deeper charts for context.
Across these variations, I iterated on interaction patterns like hover tooltips, highlighted data points, and time controls (year, month, week) so traders could zoom out for long-term trends or zoom in to pinpoint specific shifts. The goal was to give traders multiple “views” of the same strategy, making it easier to understand impact, track growth over time, and compare performance without feeling overwhelmed by dense data.
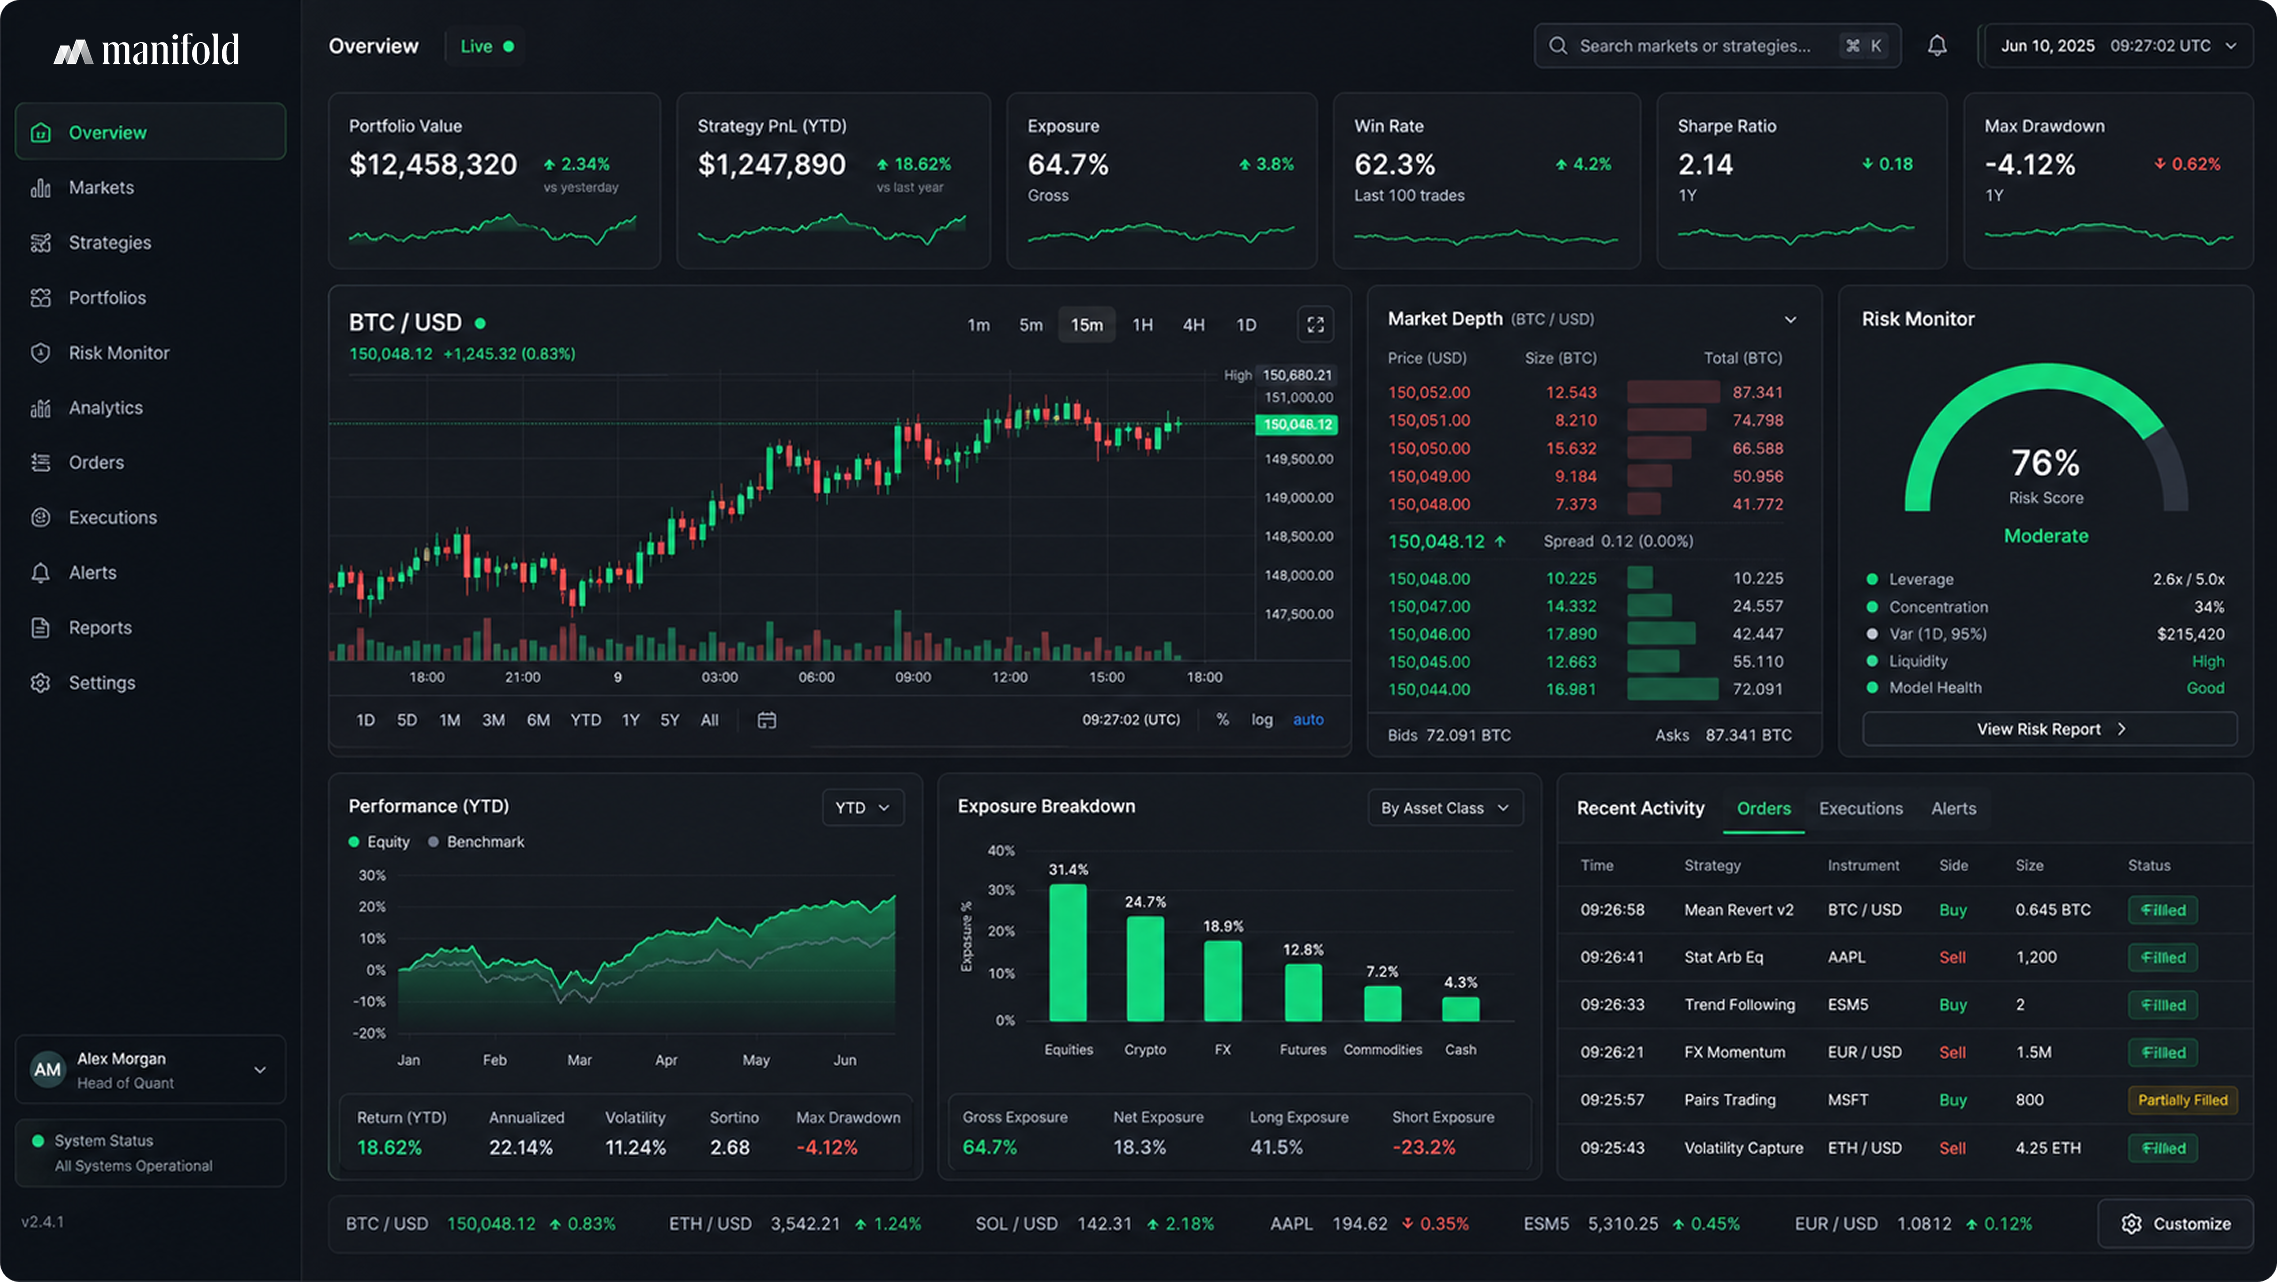
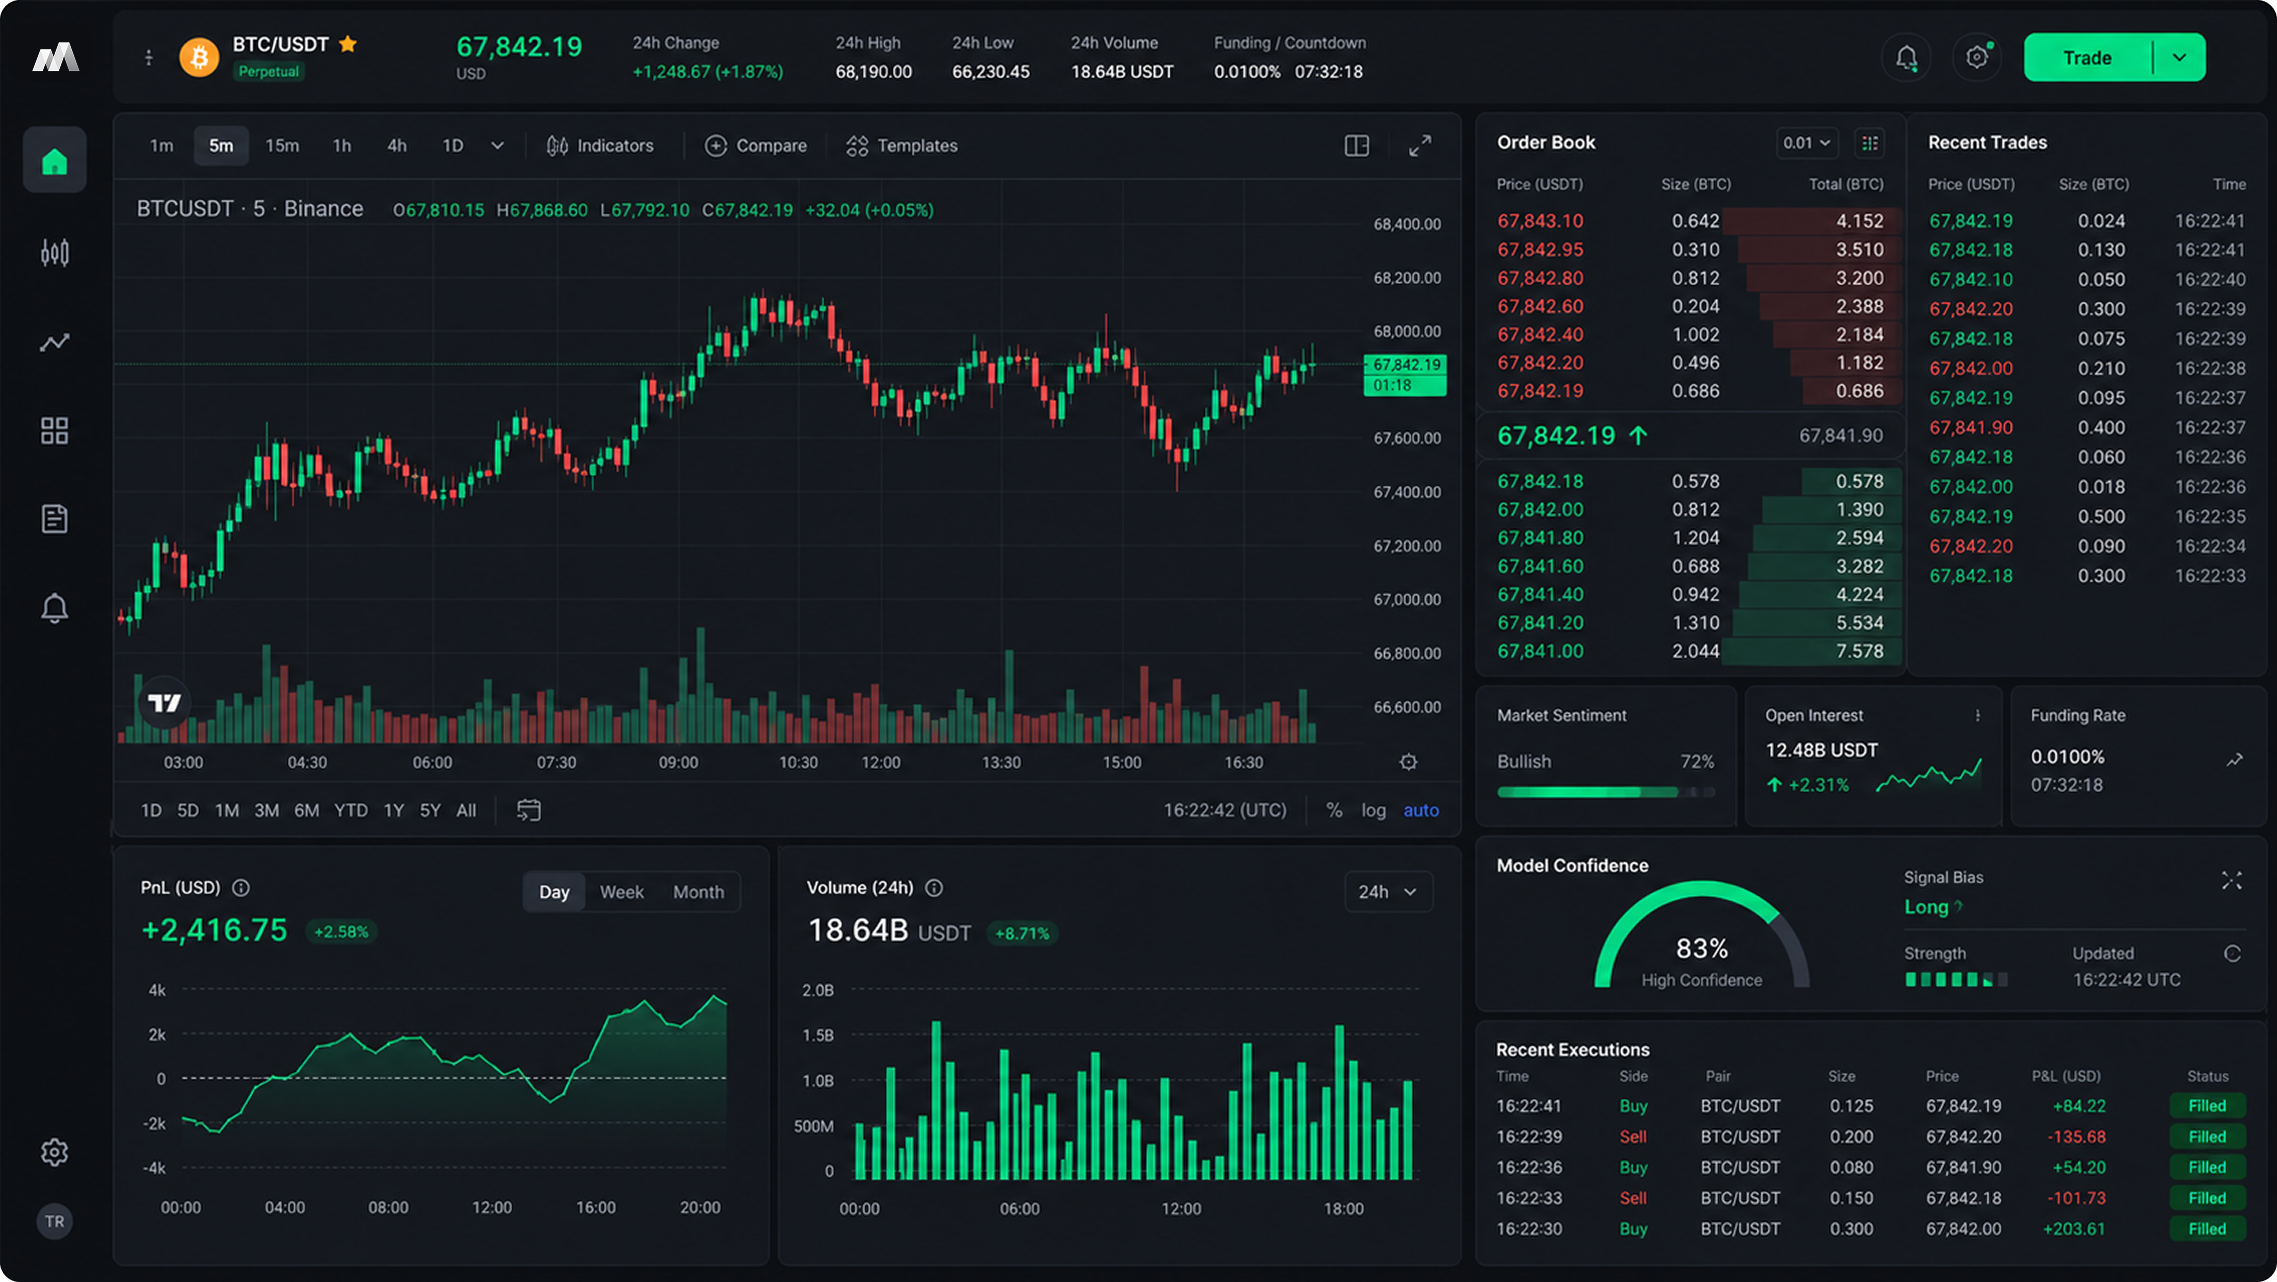
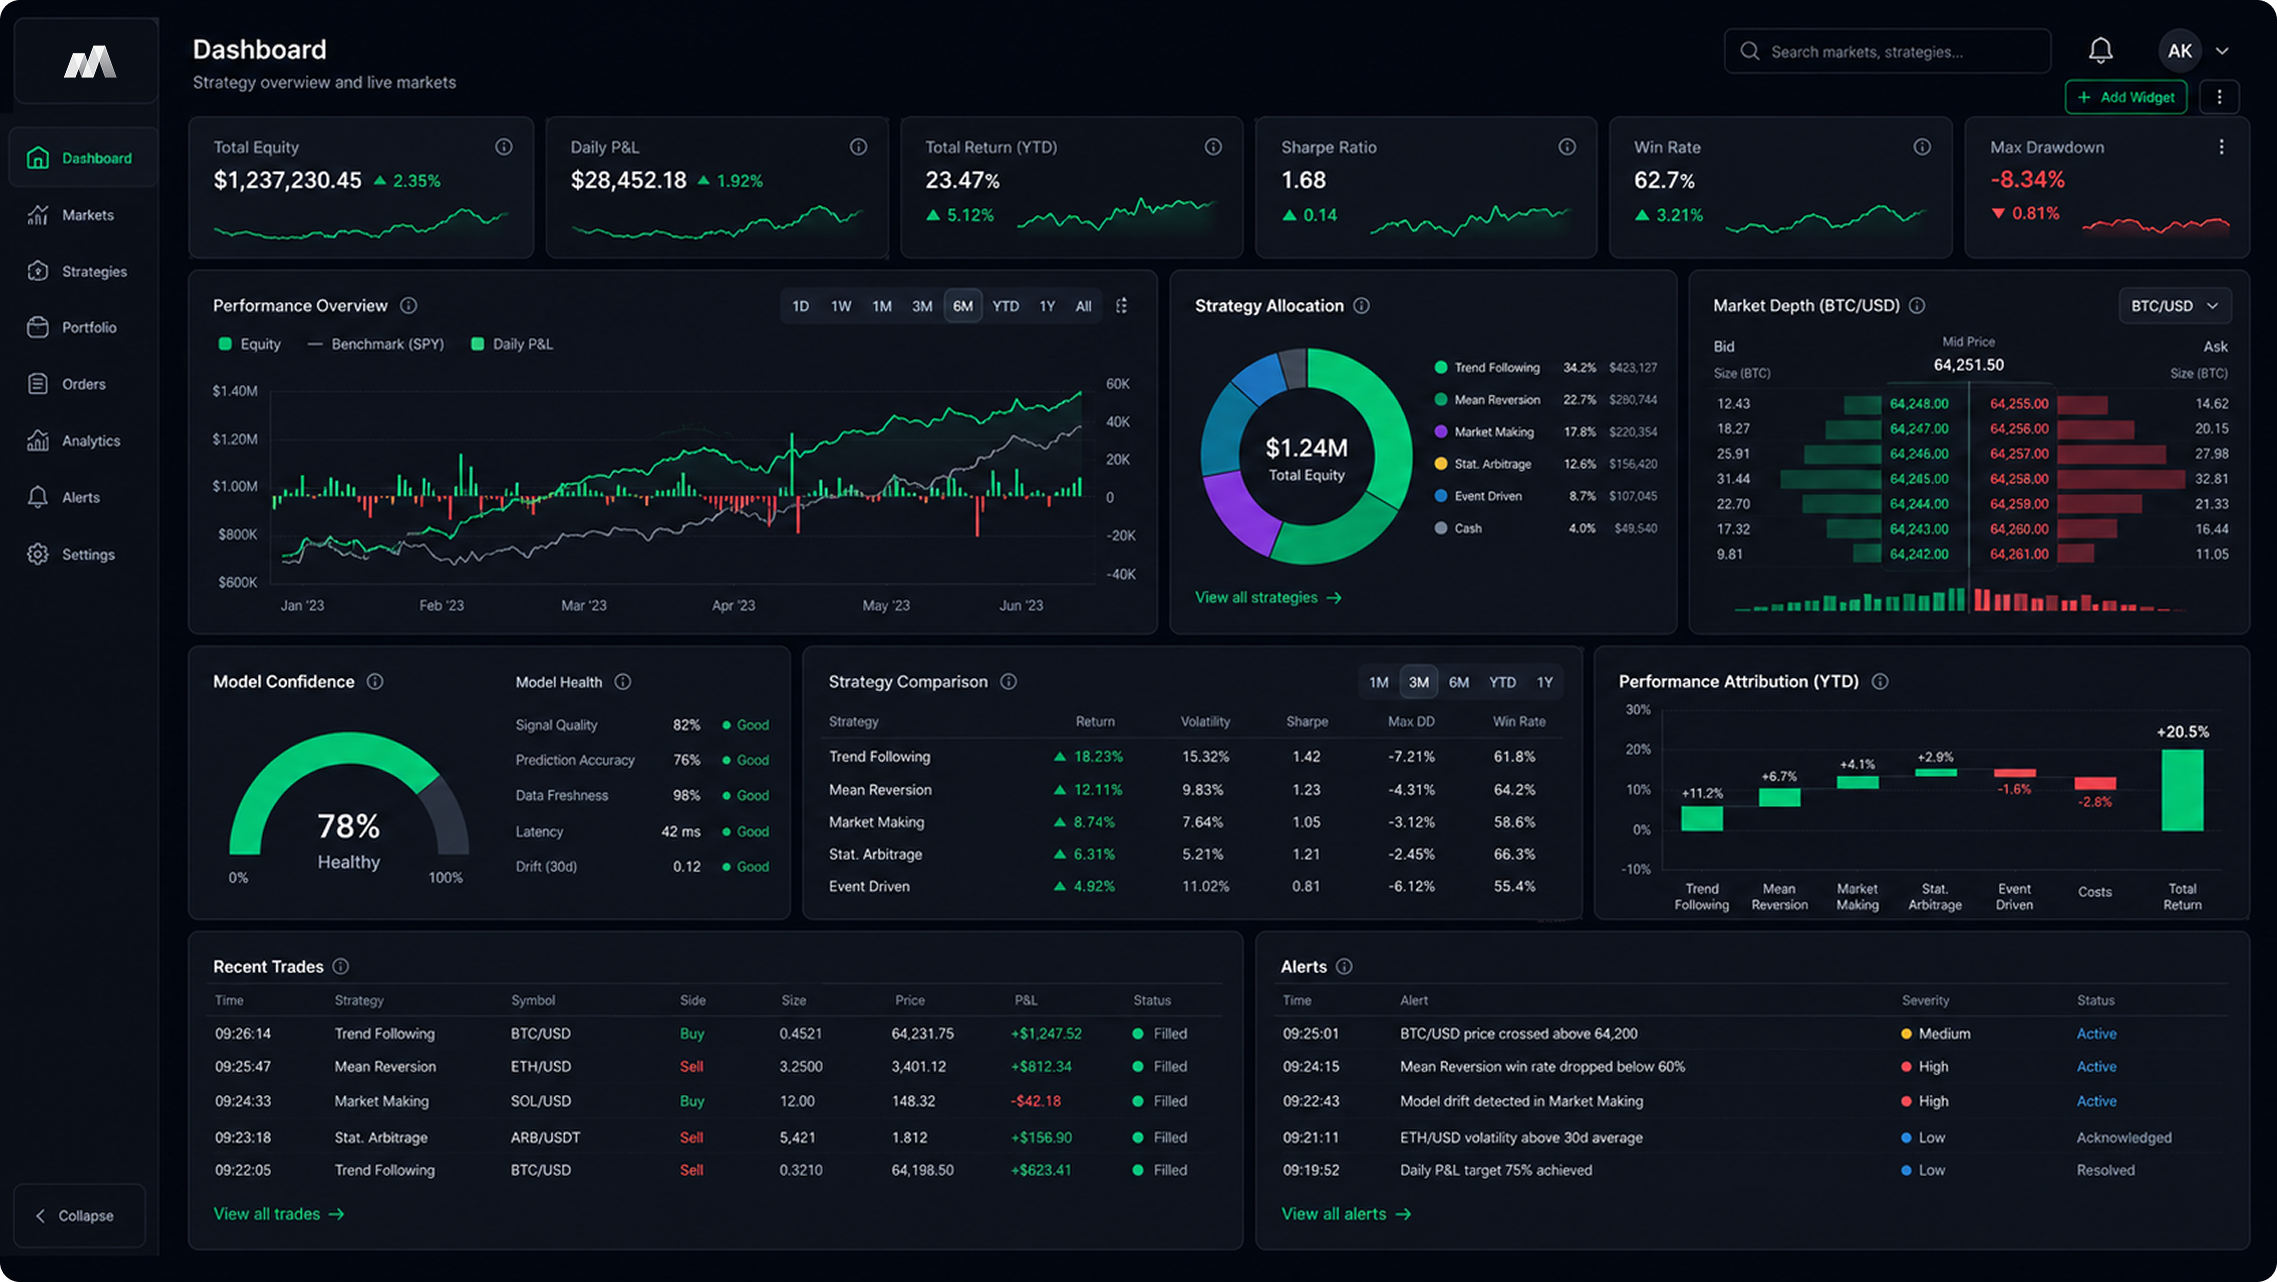
FINAL SCREEN DESIGNS
The final screen designs explored several dashboard structures to give Manifold’s traders flexible ways to view the same strategy data. Each variation emphasized different priorities, such as a high-level portfolio overview, real-time execution monitoring, or deeper analytics and attribution, so traders could choose the layout that best matches how they work. By shifting the hierarchy of charts, KPI modules, market depth panels, and activity tables, the designs made it easy to highlight what matters most in the moment, whether that is performance trends, risk and confidence signals, liquidity conditions, or trade flow. Overall, the final set functions as a modular system that supports different preferences while keeping the interface consistent, calm, and highly readable.
Key learnings
What worked:
Modular components reduced chaos and increased scalability
Strong hierarchy made screens feel lighter, even with dense content
Restrained color made performance emphasis more meaningful
Iteration with feedback clarified what traders actually need first
What didn’t work (and what I changed):
Some early screens tried to show too much at once
Certain chart styles assumed too much prior knowledge
Visual density needed stricter rules to avoid “metric fatigue”
Each of these improved as I tightened hierarchy, introduced progressive disclosure, and standardized components.